


This guide from The Clean Fight and RMI helps building owners and managers understand how high-temperature heat pumps can decarbonize steam and hot-water space heating systems. It outlines key benefits, technology basics, example products, and strategies for effective retrofit integration. High-temperature heat pumps offer a new, less disruptive path to electrification for buildings with steam or hot water distribution.
Electric heat recovery chiller implementation at Upper East Side high-rise
This case study was chosen as part of the Empire Building Challenge competition. Click here to learn more about the Empire Building Challenge competition.
Tags
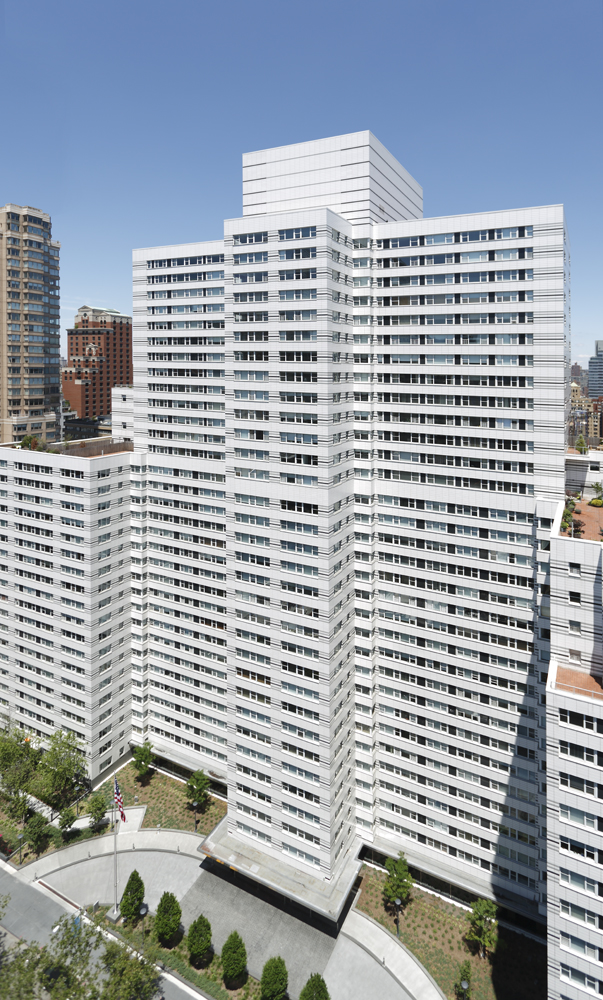
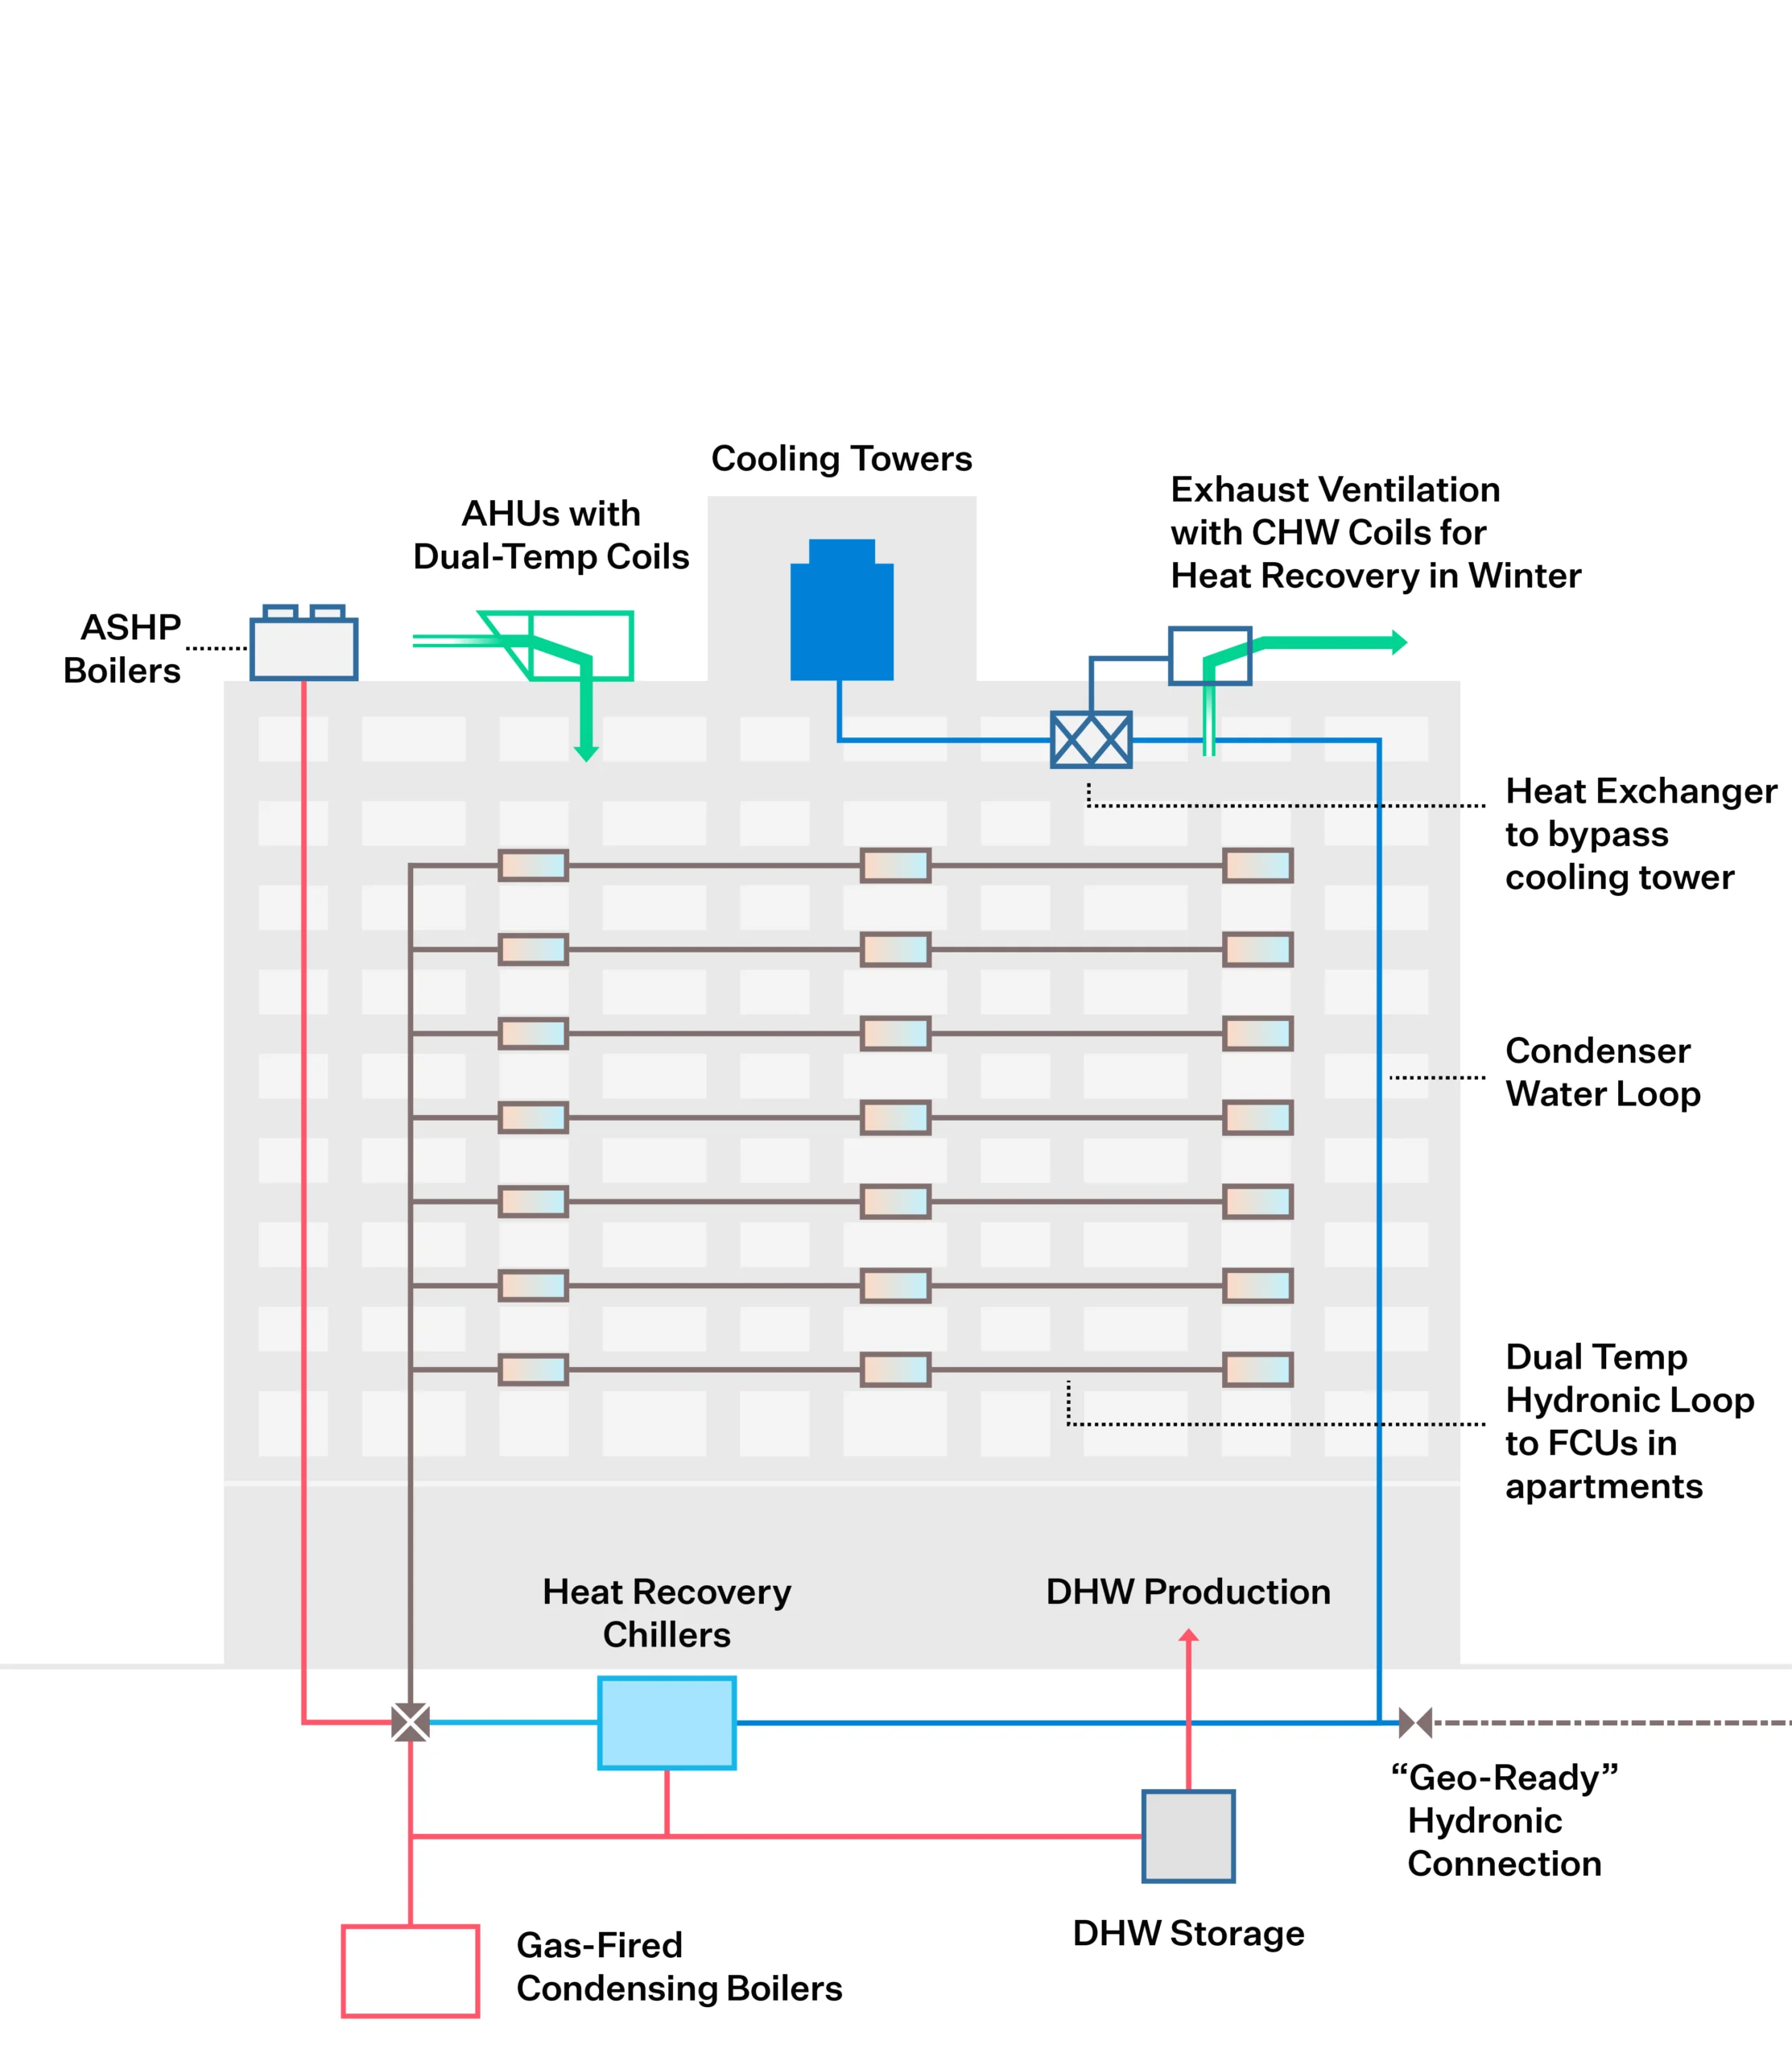
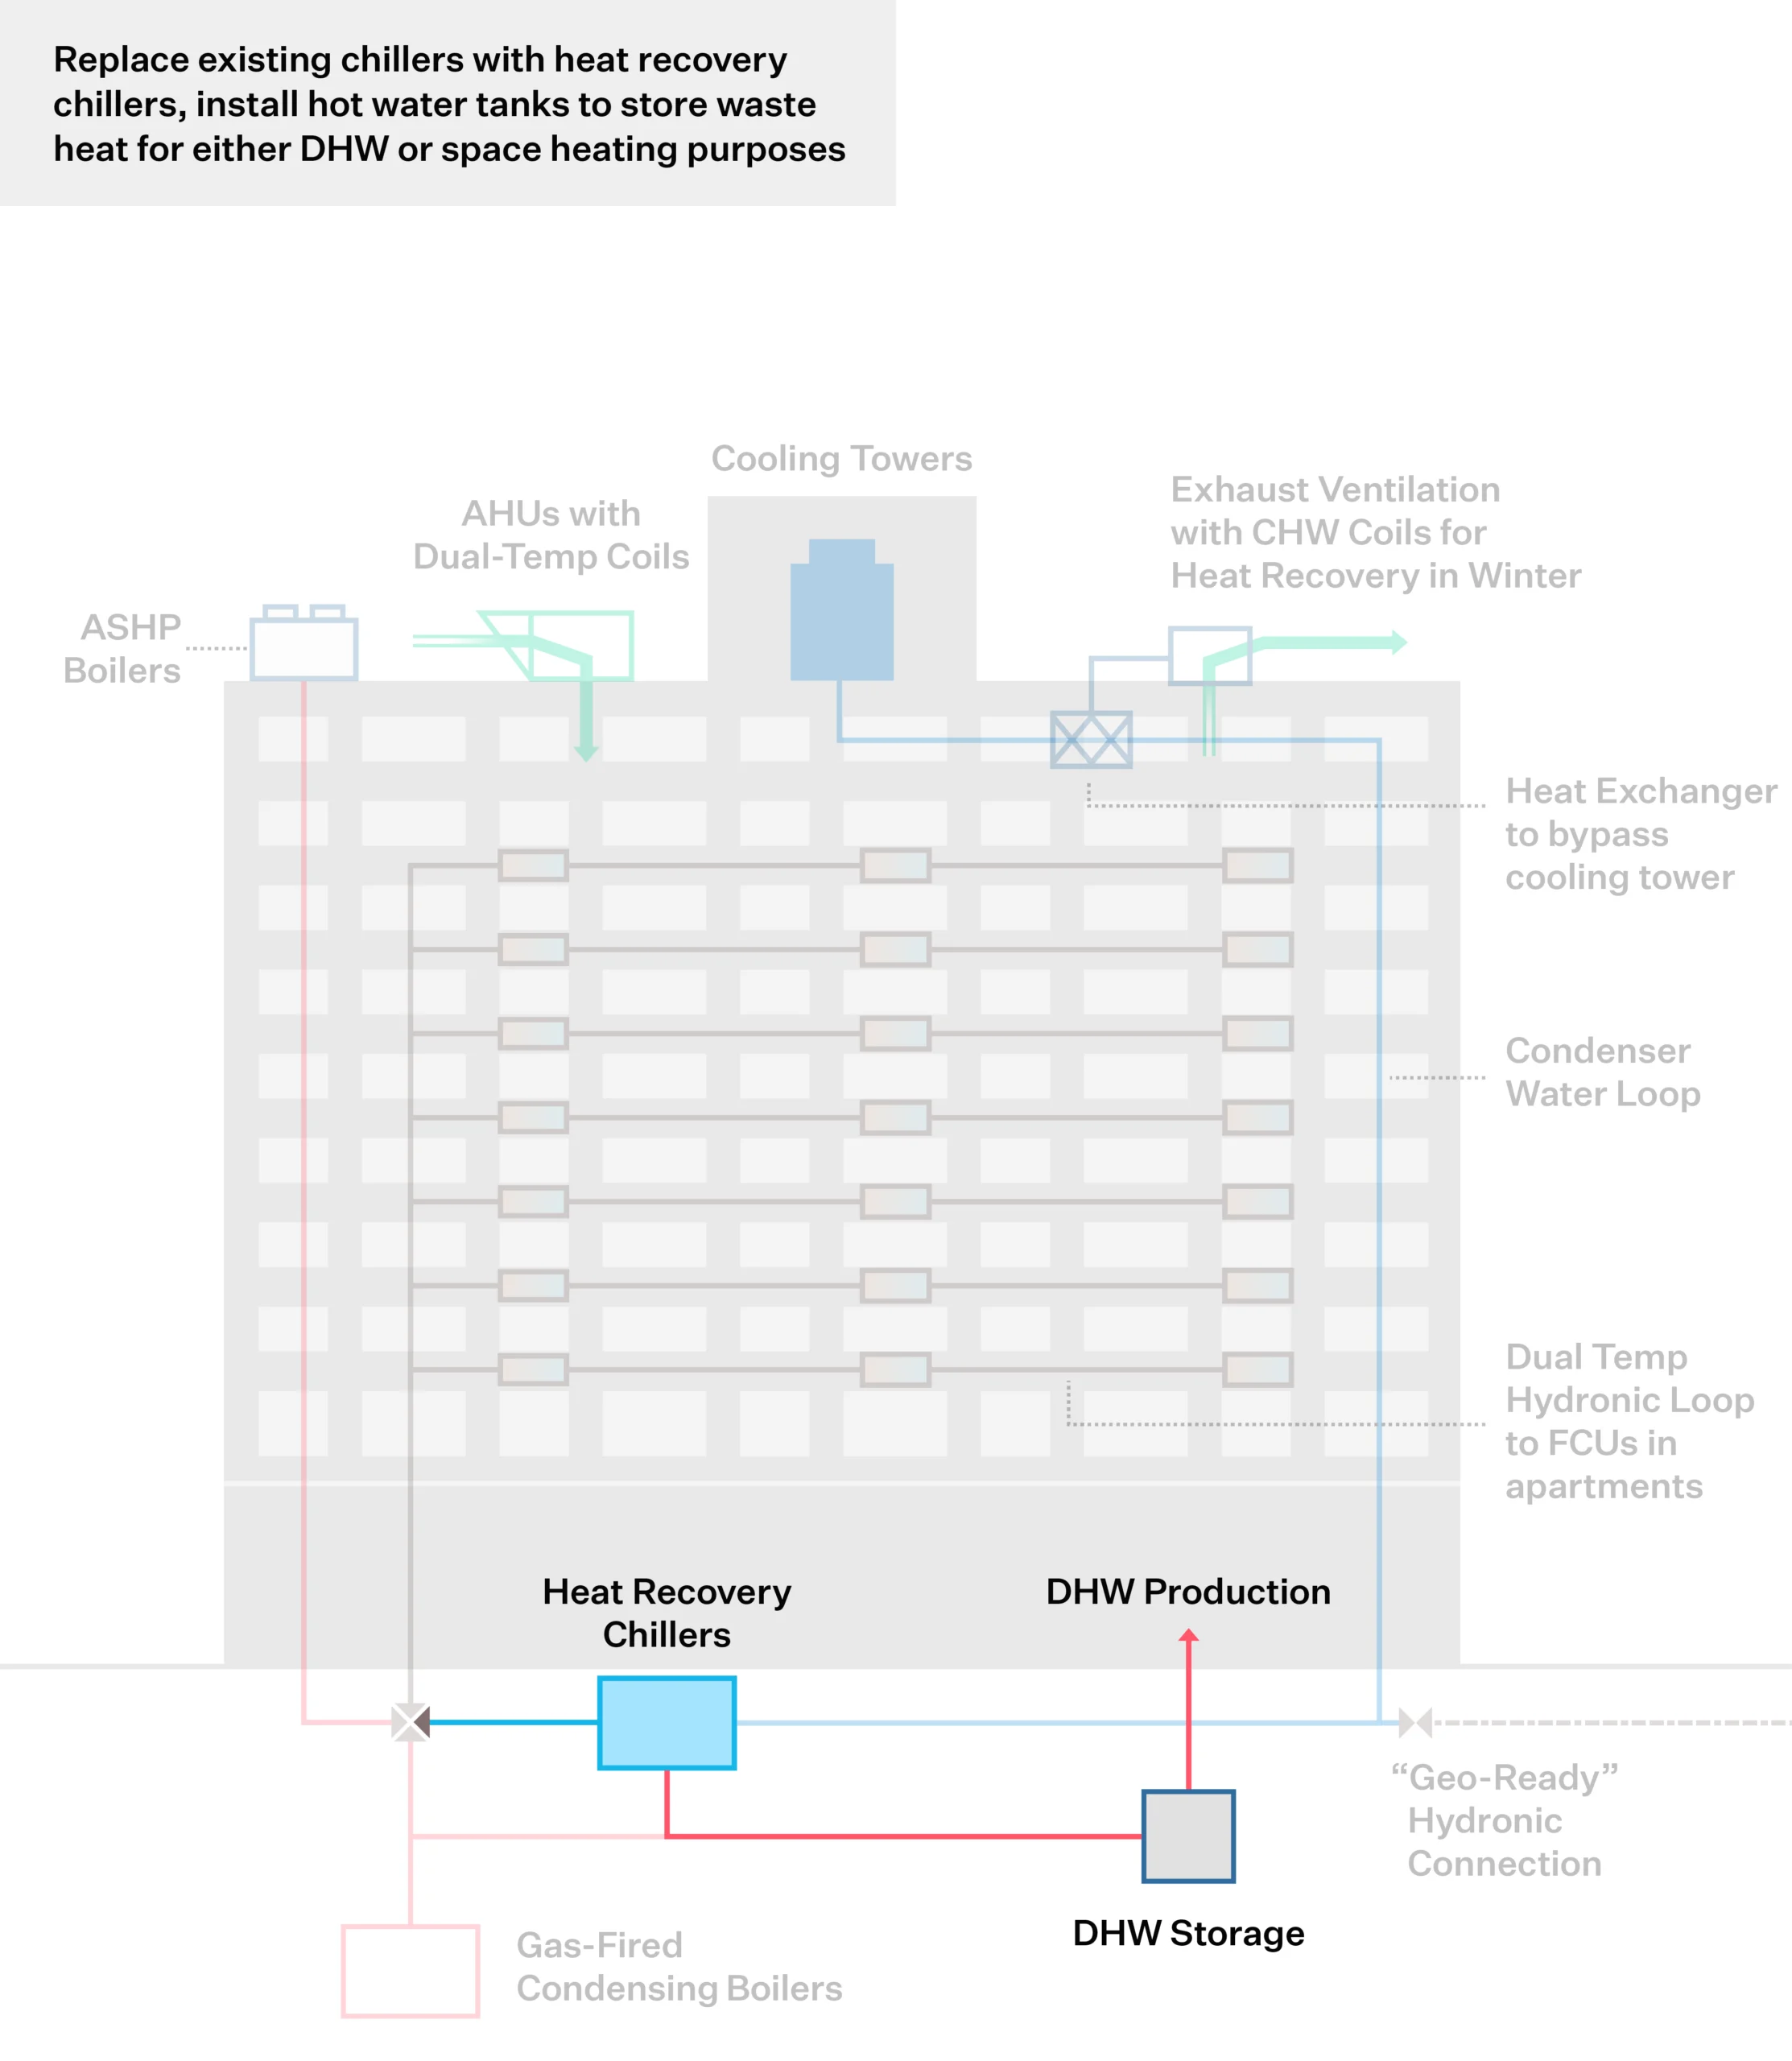
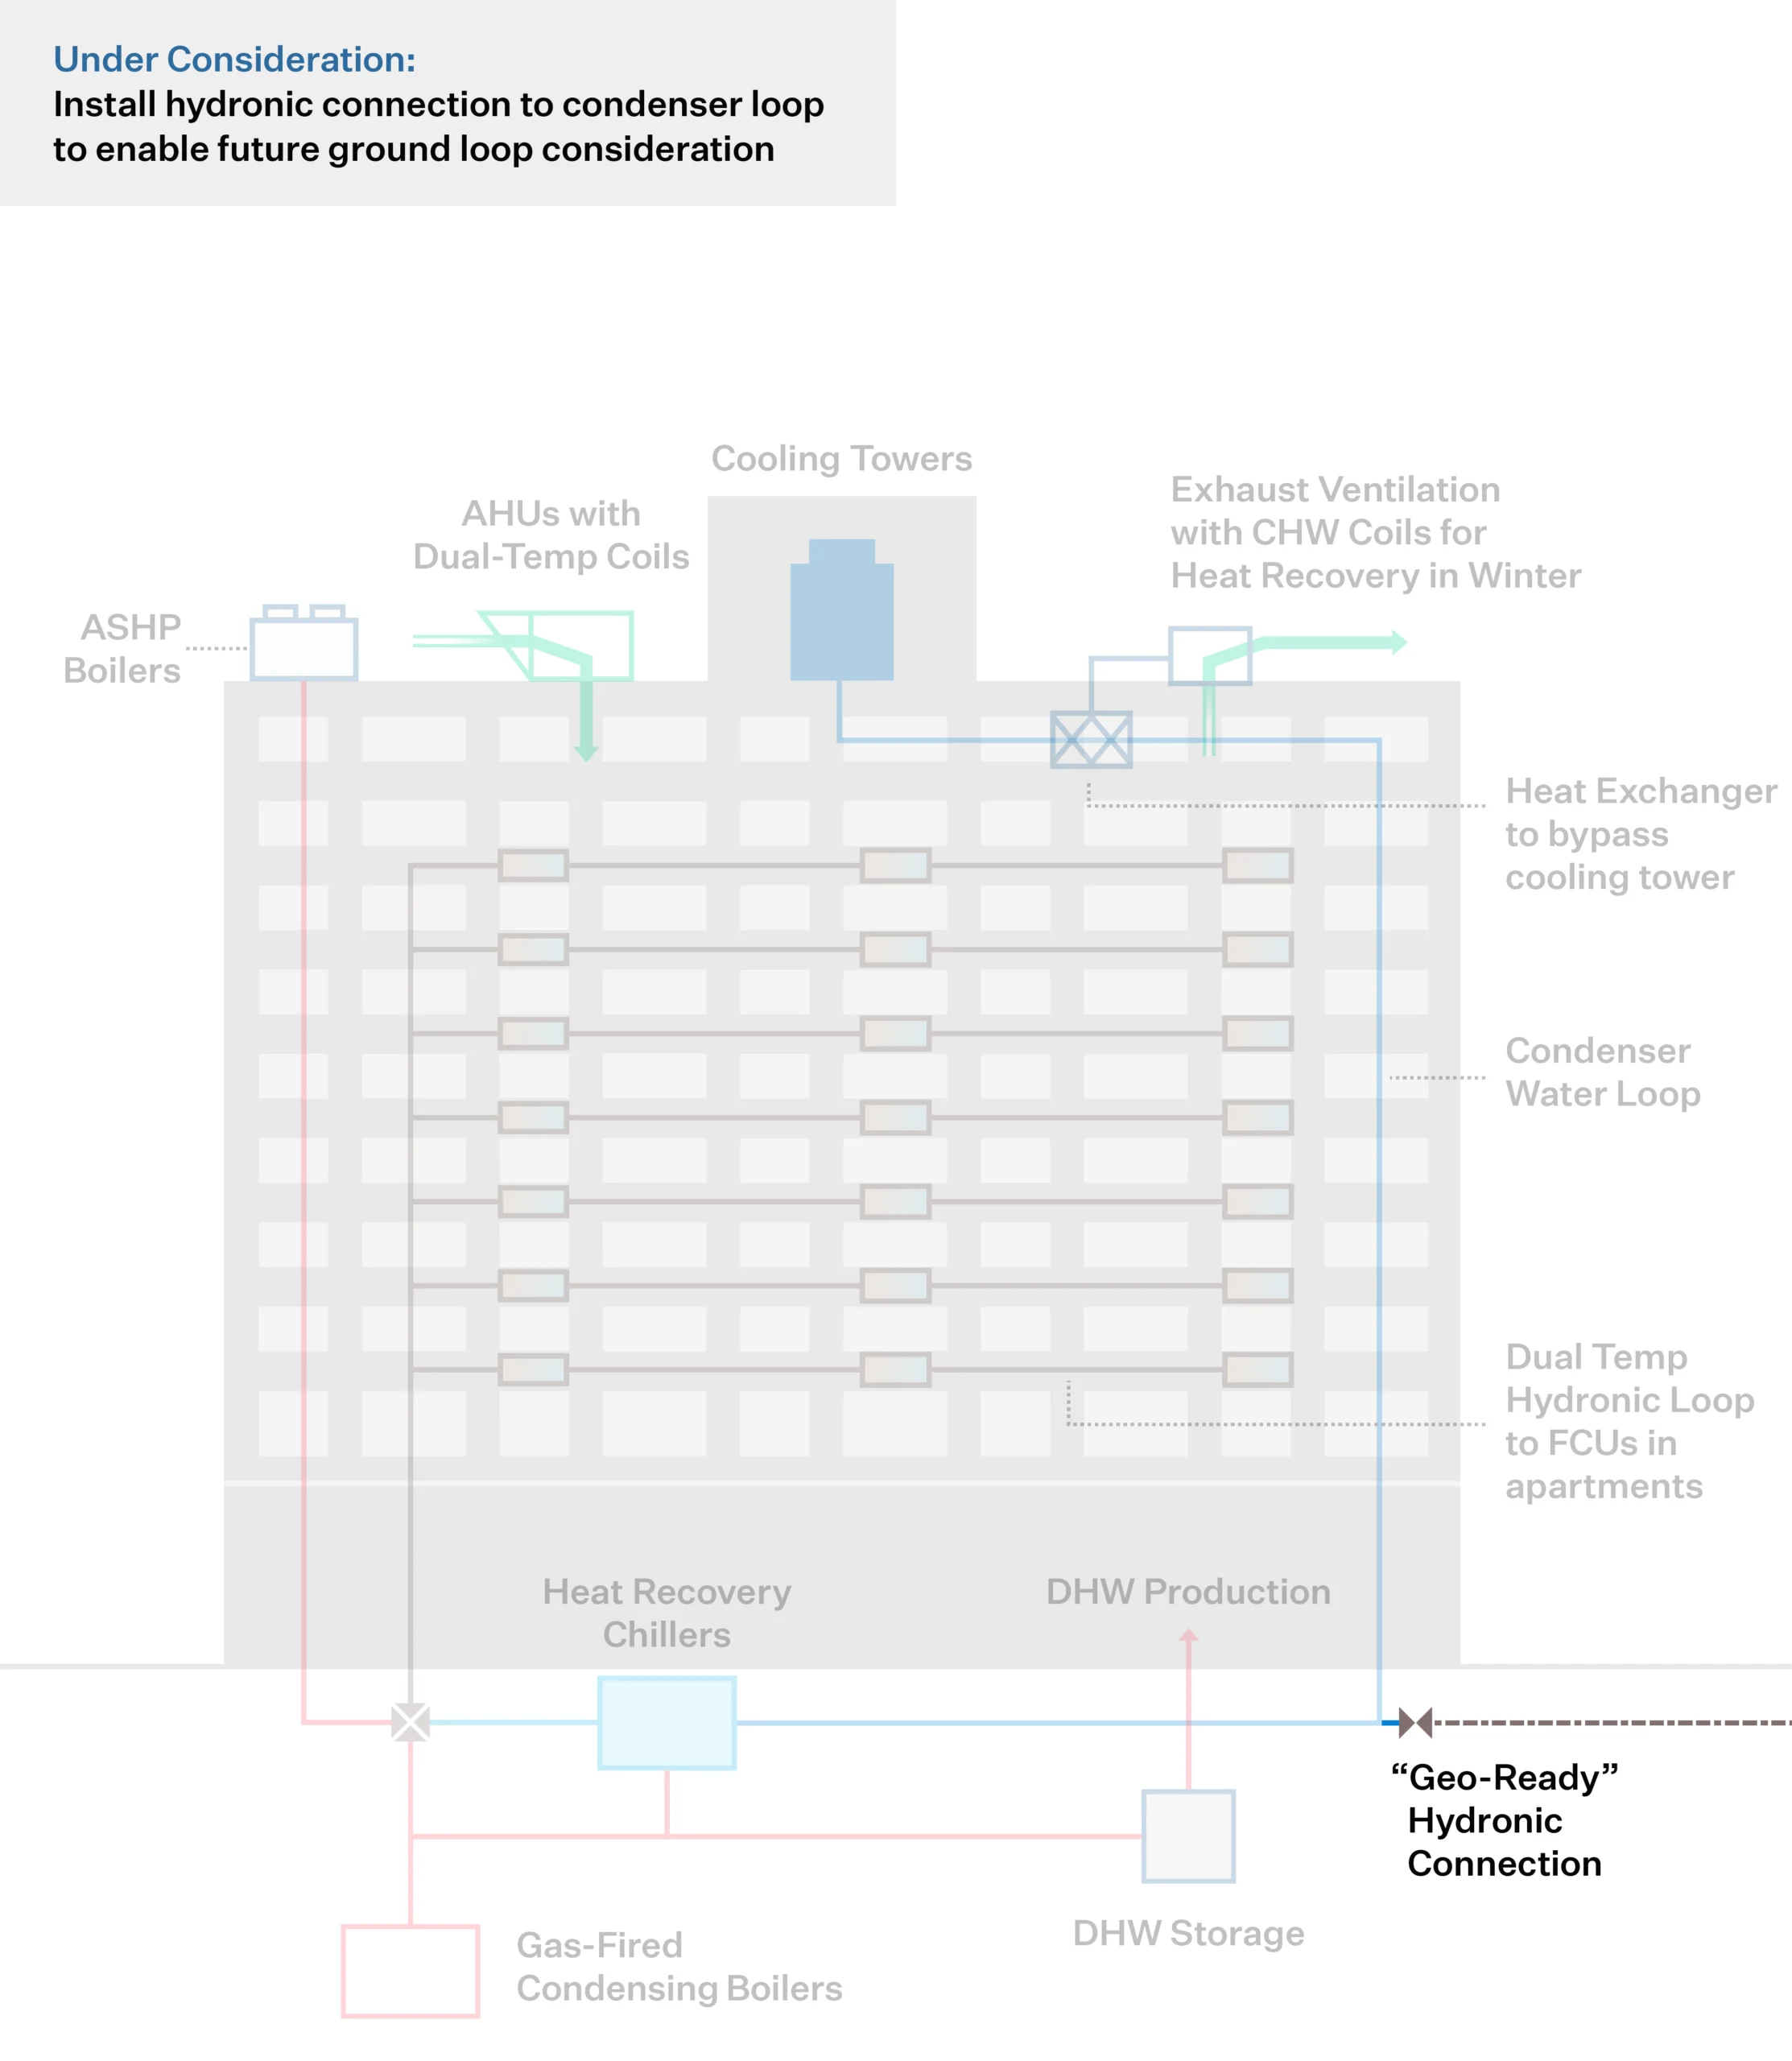
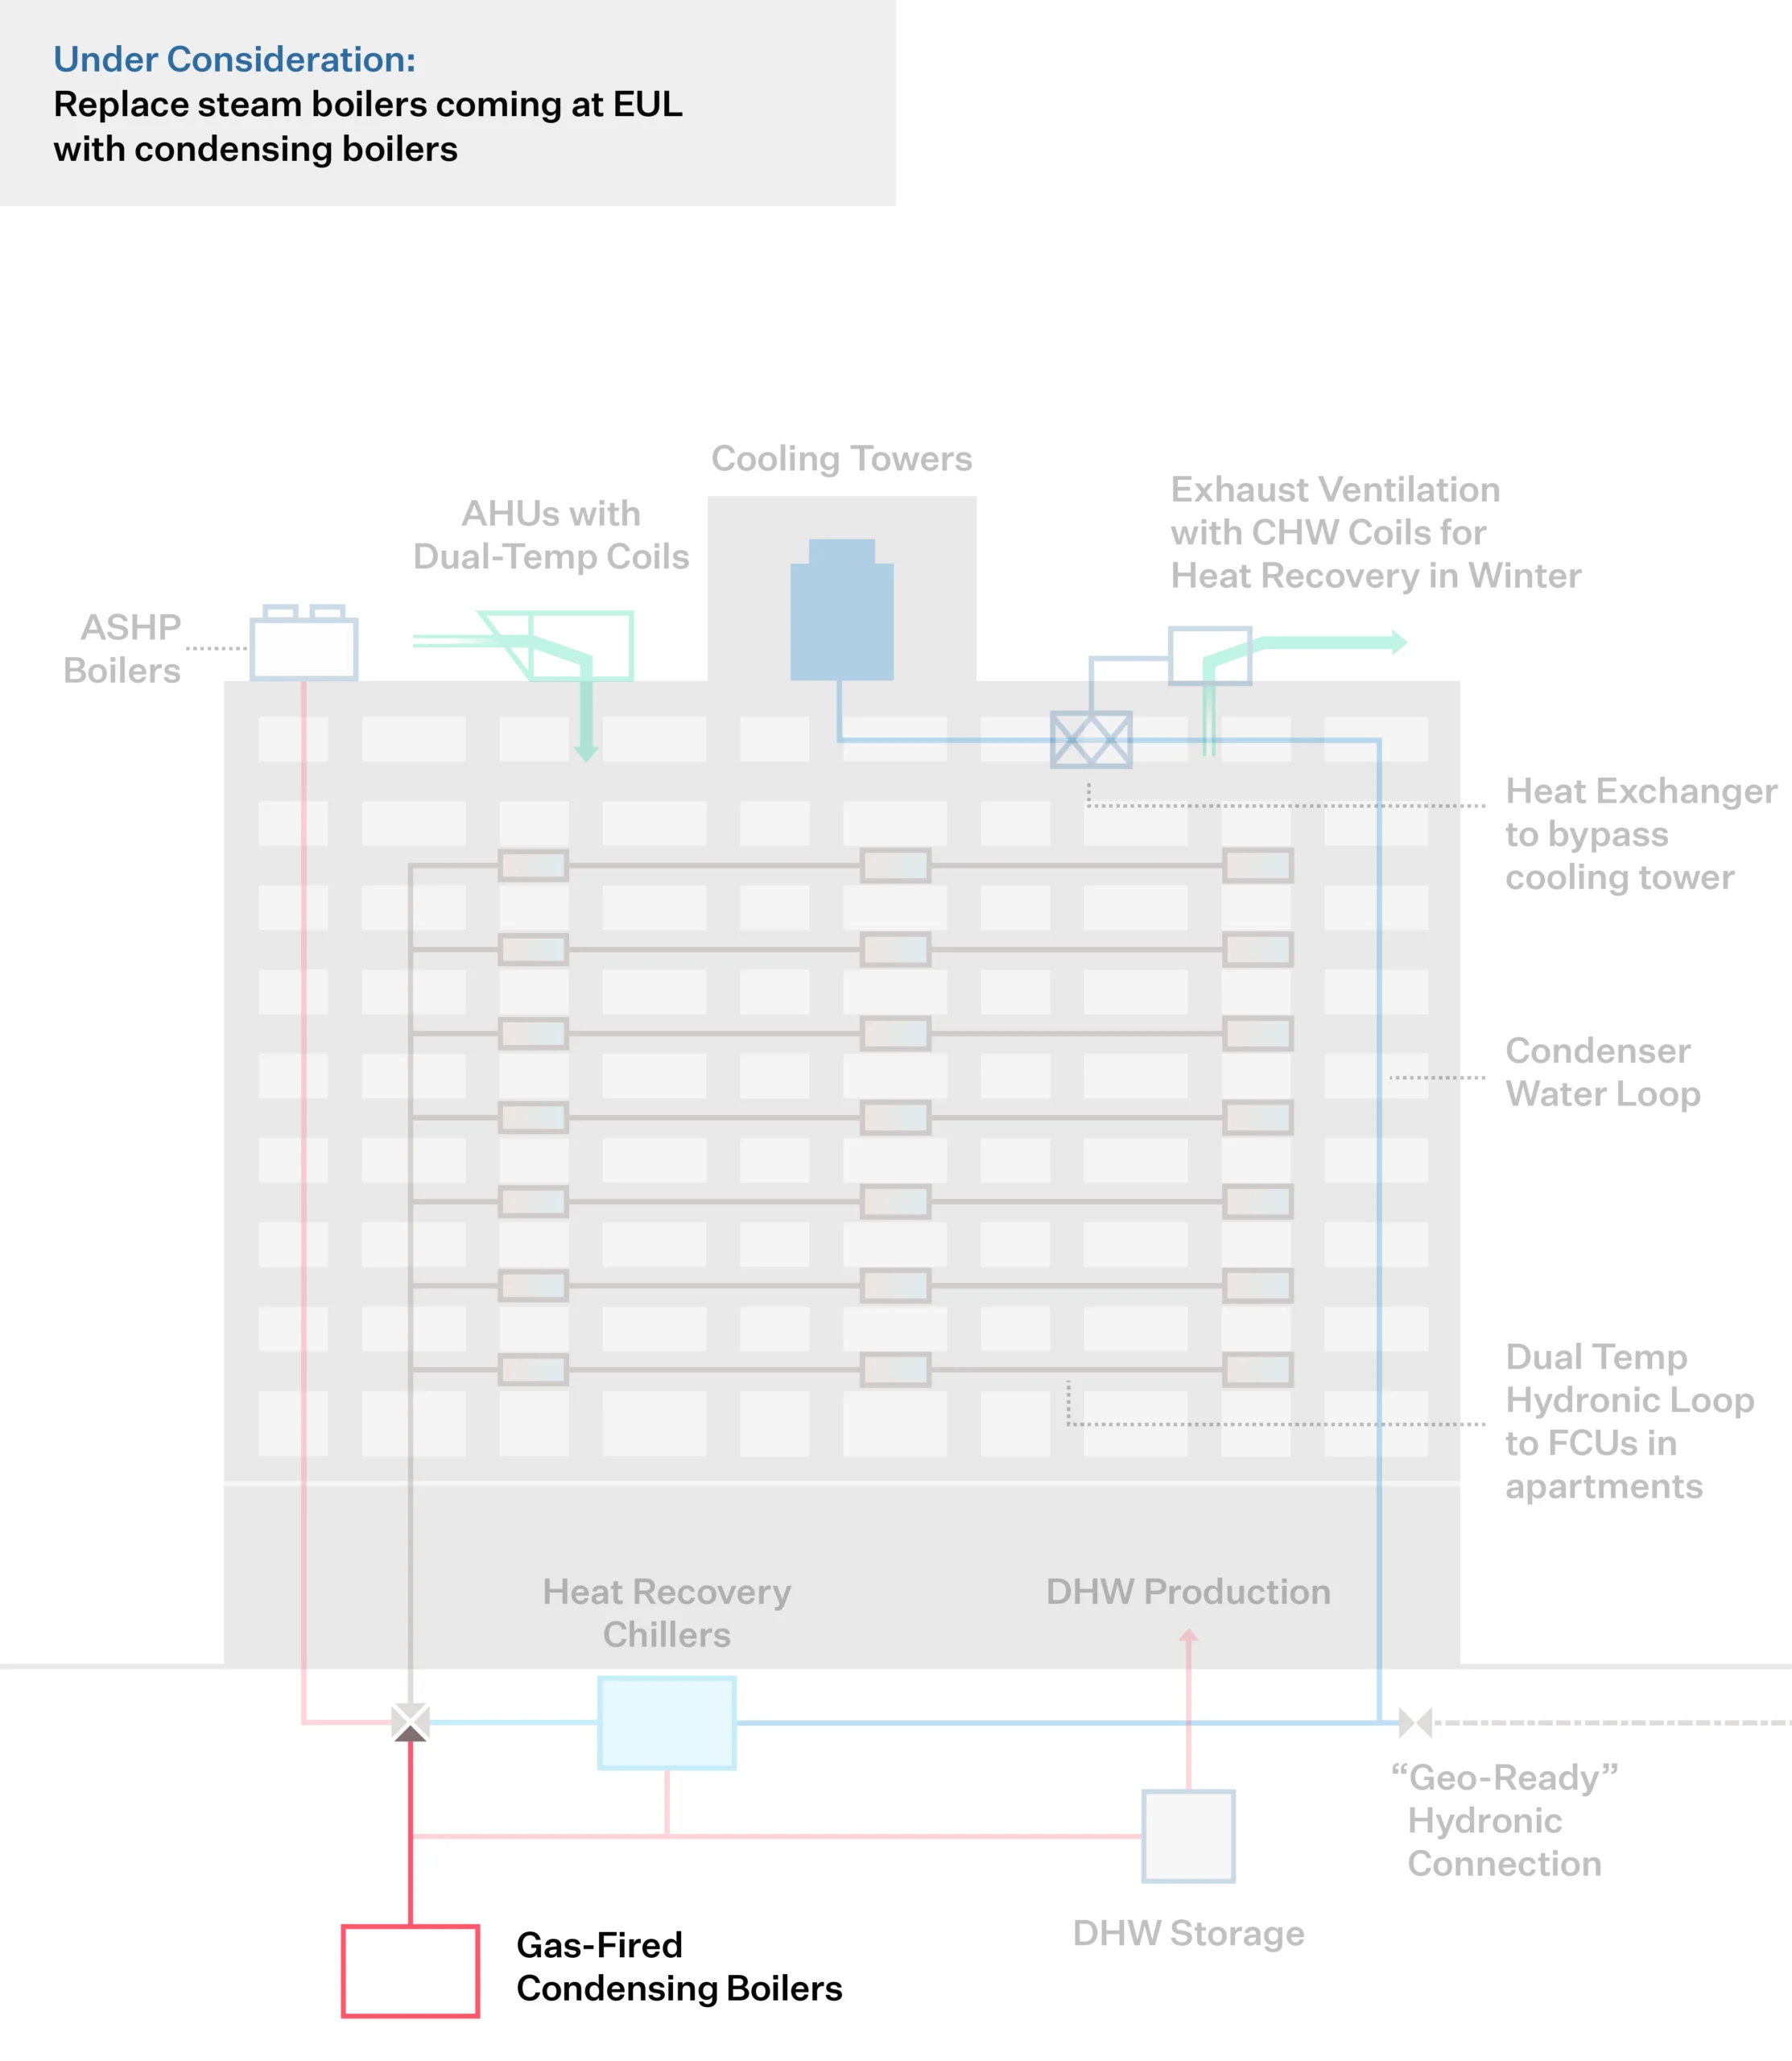
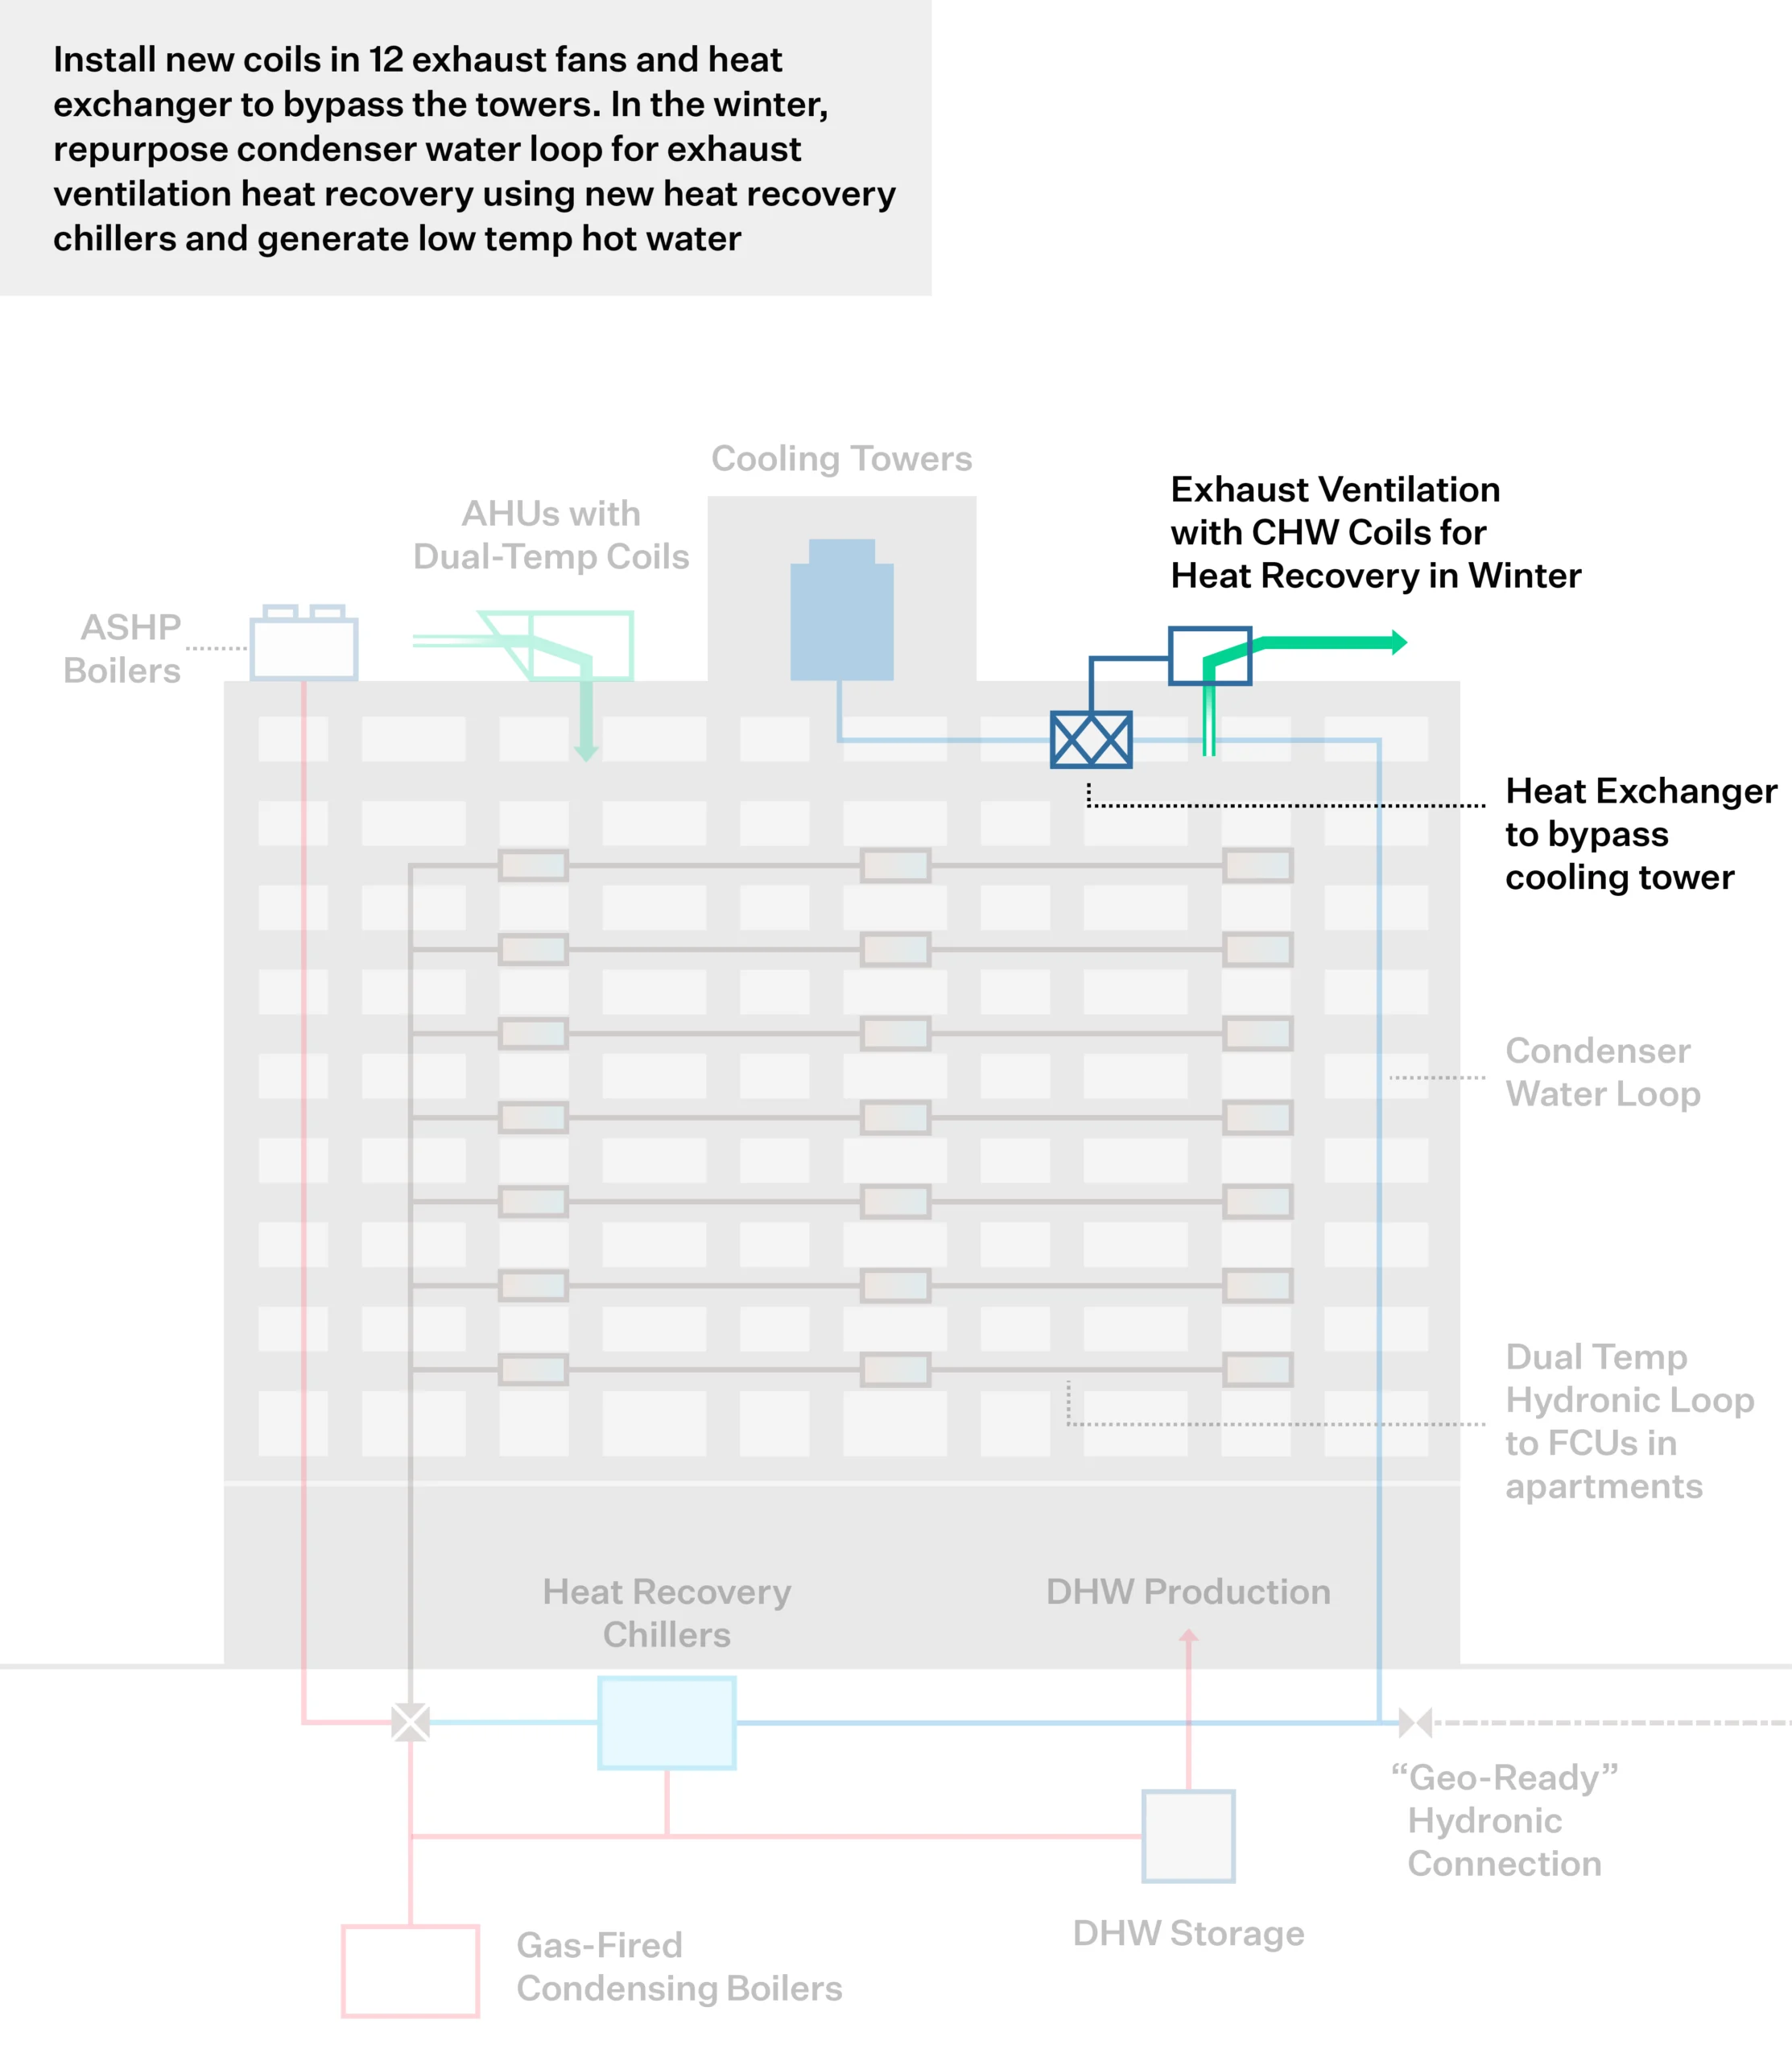
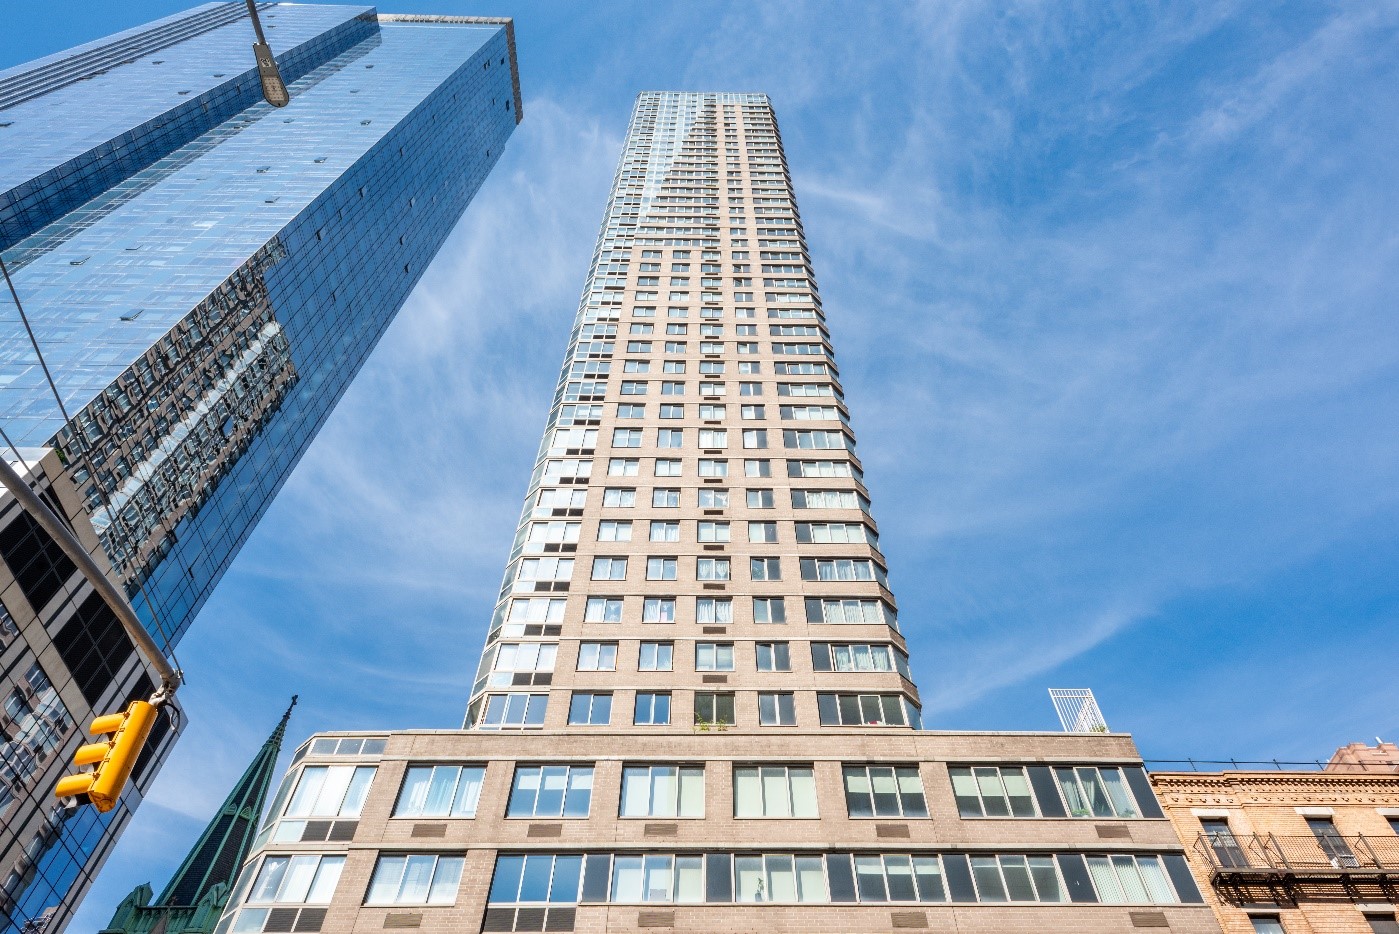
215 East 68th Street is an approximately 1M+ square foot multifamily building in the Upper East Side of Manhattan. Built in 1962 and spanning 32 floors, the building supports tenant heating, cooling, and domestic hot water needs through natural gas boilers and absorption chillers. As a result, the building burns fossil fuels for the entire year, putting the building in Local Law 97 penalty range starting in 2030. Rudin Management plans to retrofit the outdated system with new electric heat recovery chillers to offset natural gas usage and align with New York City’s electrification efforts. The new system eliminates the need for fossil fuel boilers to create cooling and domestic hot water in the summer. The building also intends to install “geo-ready” thermal taps to prepare for a potential future ground loop under the existing parking lot and heat recovery from the 24/7 building exhaust system. The project largely decarbonizes building operations and aligns the building with company-wide sustainability goals.
Project Highlights
Step 1
Step 1: Examine Current Conditions
A baseline assessment is key to understanding current systems and performance, then identifying conditions, requirements or events that will trigger a decarbonization effort. The assessment looks across technical systems, asset strategy and sectoral factors.
Building System Conditions

- Equipment nearing end-of-life
- Efficiency improvements
Asset Conditions

- Capital event cycles
- Carbon emissions limits
Market Conditions

- Technology improves
- Policy changes
- Infrastructure transitions
- Fuels phase out
The last major cooling plant upgrade at 215 East 68th Street was in 2001 when three, low pressure steam absorption chillers were installed. Since then, NYC introduced new carbon emission limits as part of LL97. The new laws push for the electrification of buildings to mitigate significant financial penalties associated with burning fossil fuels. In the case of 215 East 68th Street, building ownership is facing annual penalties exceeding $250,000 per year starting in 2030. As a result, Rudin sees an opportunity to replace the fossil-fuel cooling plant with an electric plant that generates domestic hot water and recovers building waste heat. The new system eliminates the 2030 penalty entirely and significantly reduces the building energy use intensity (EUI).
Step 2
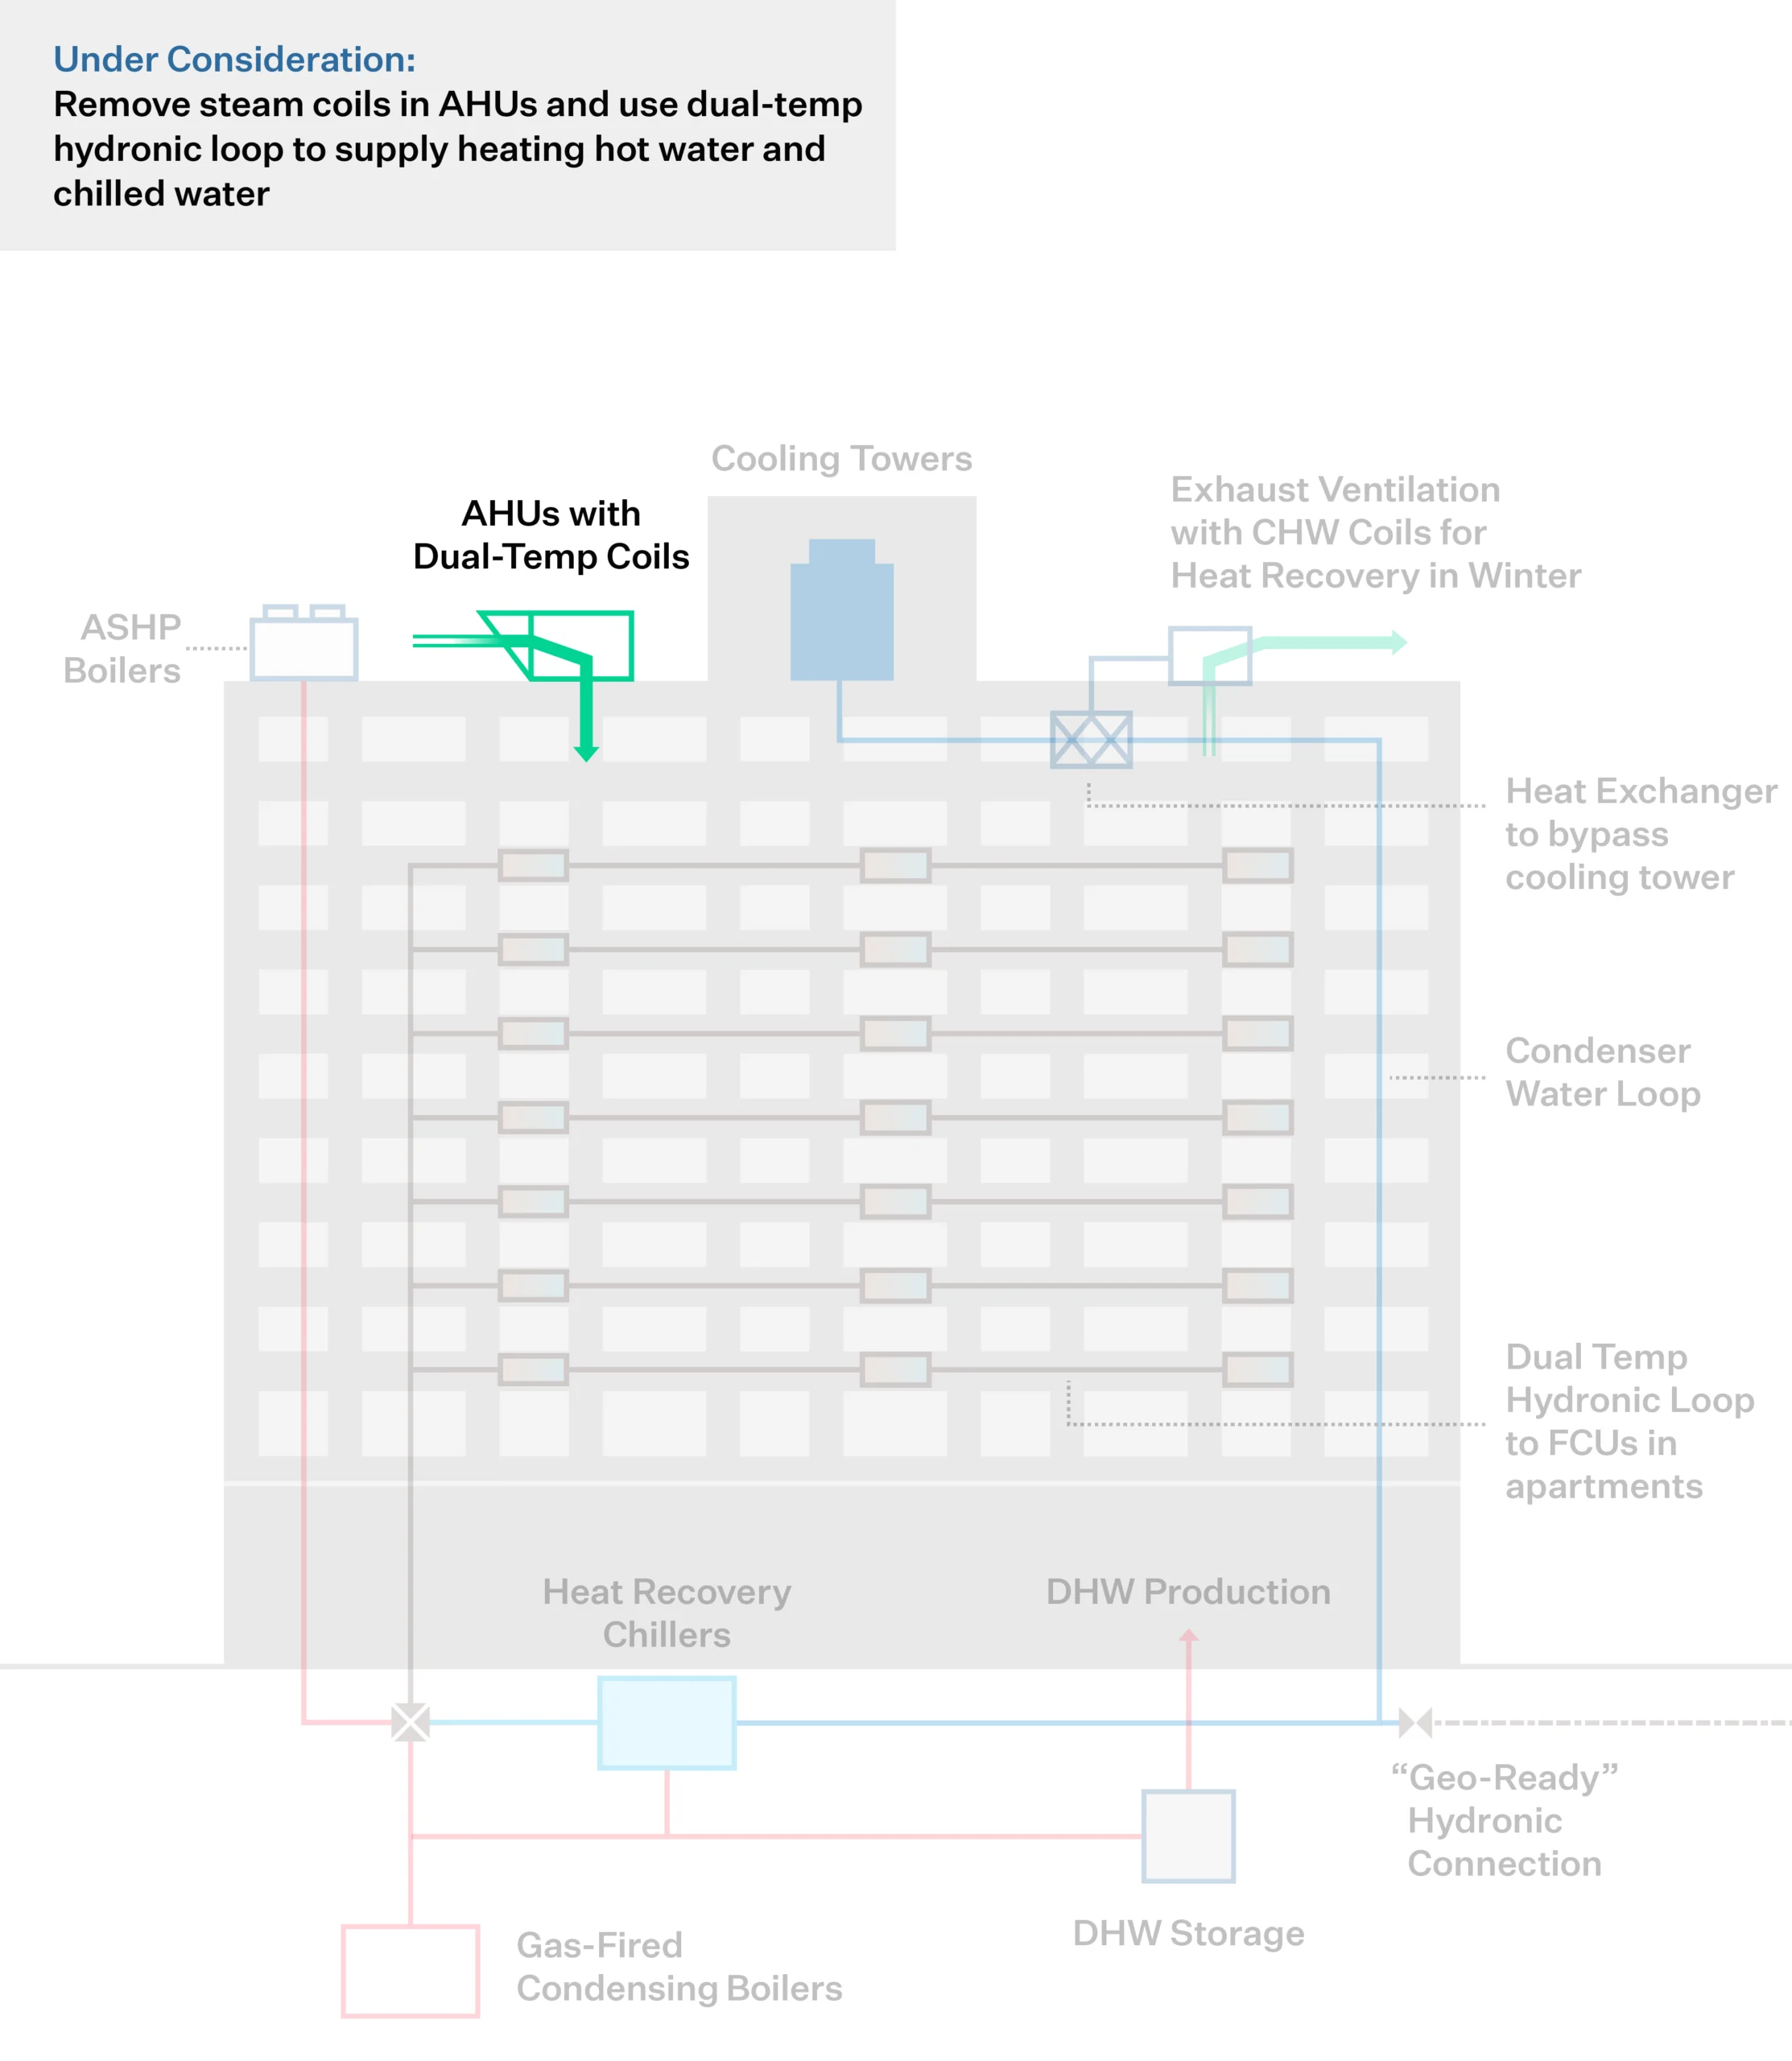
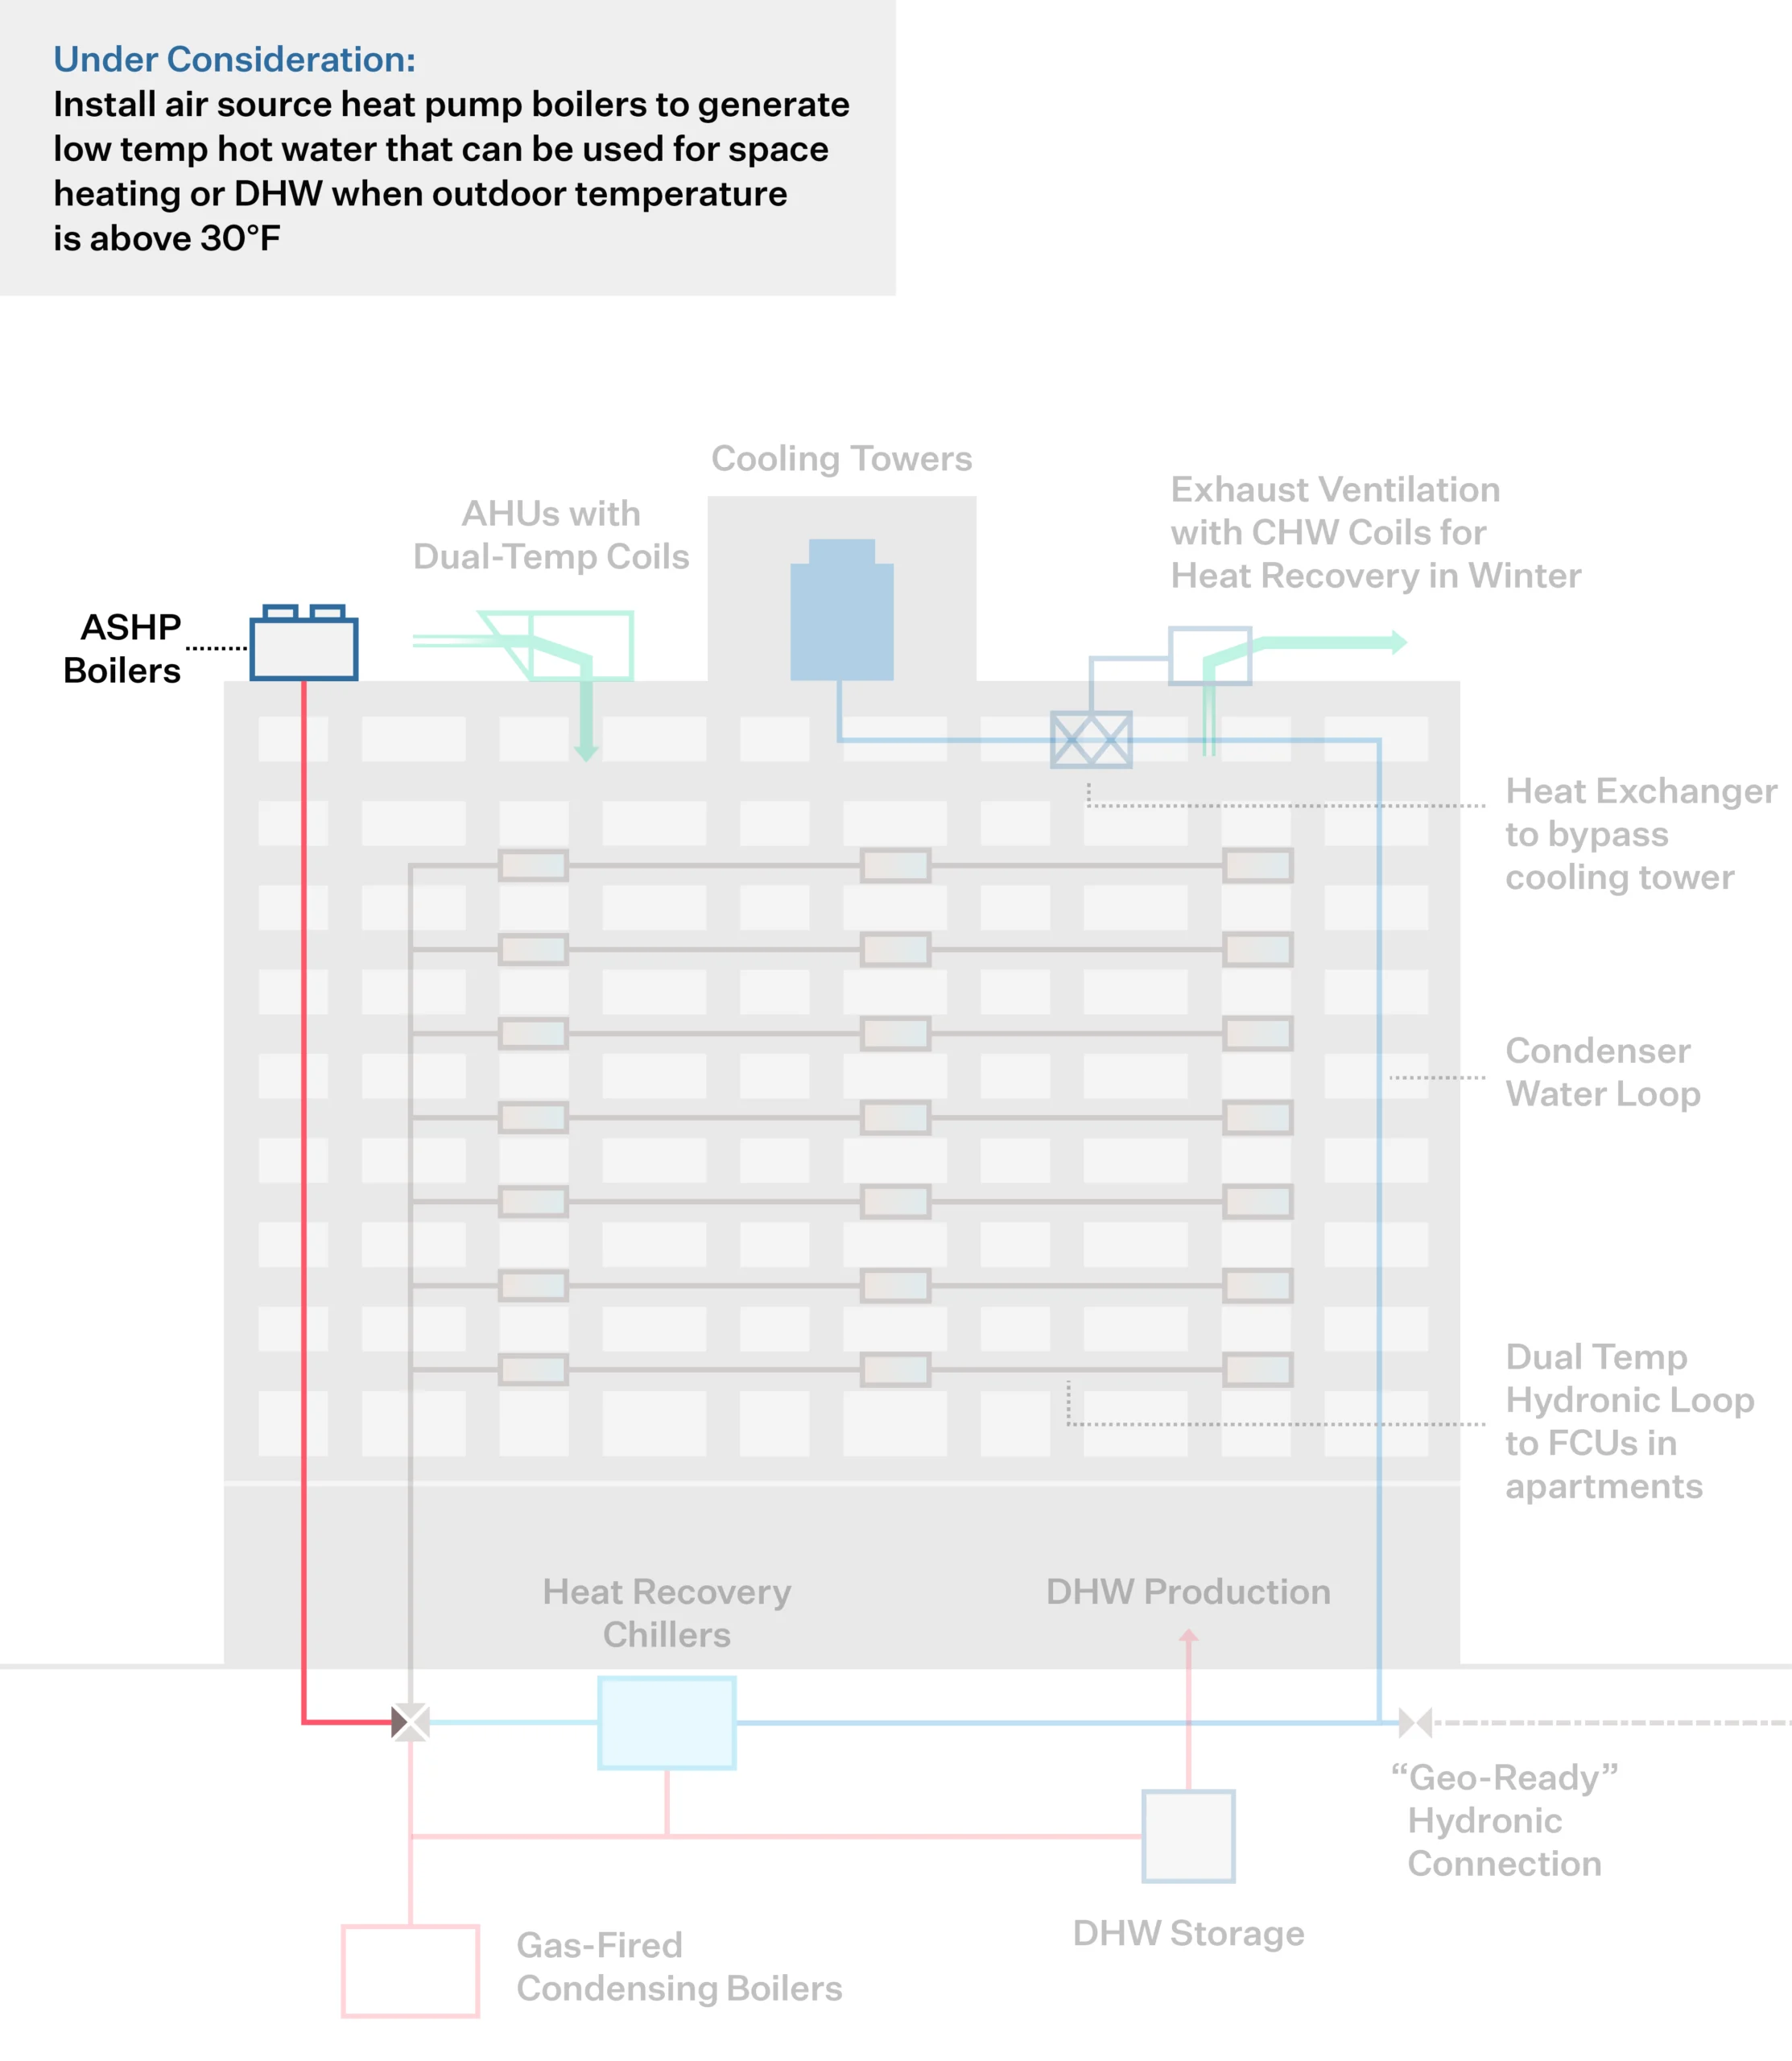
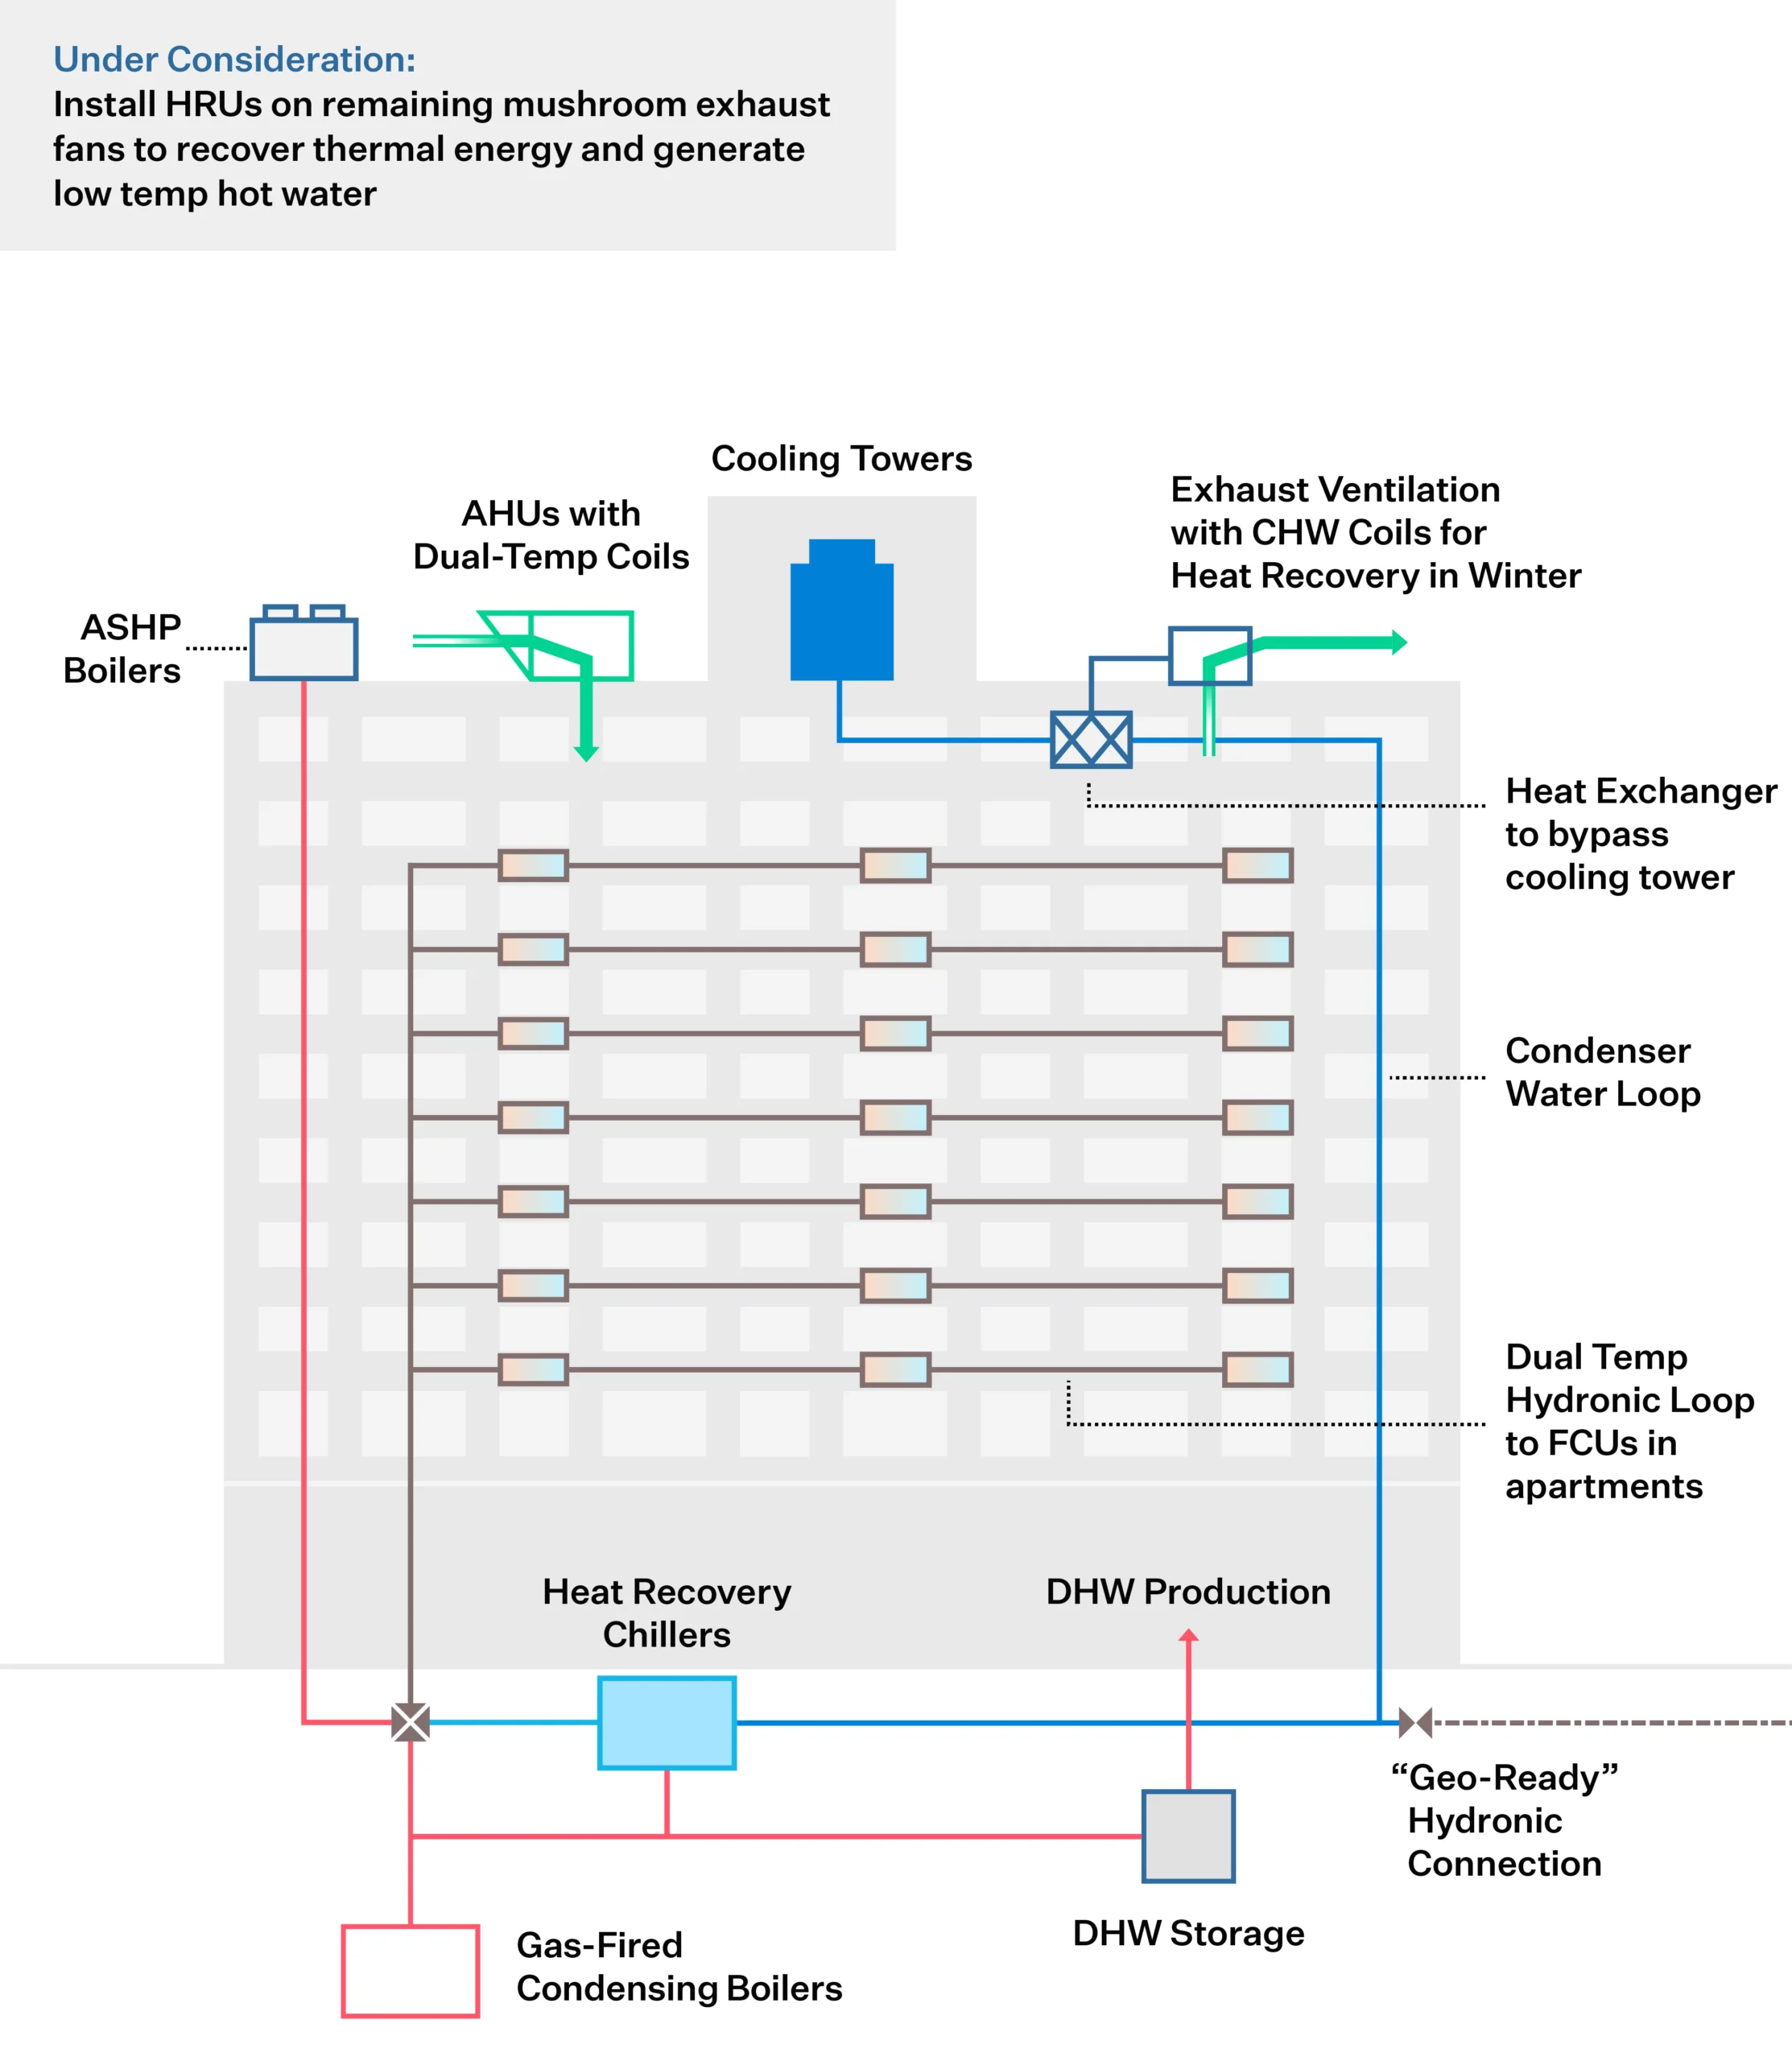
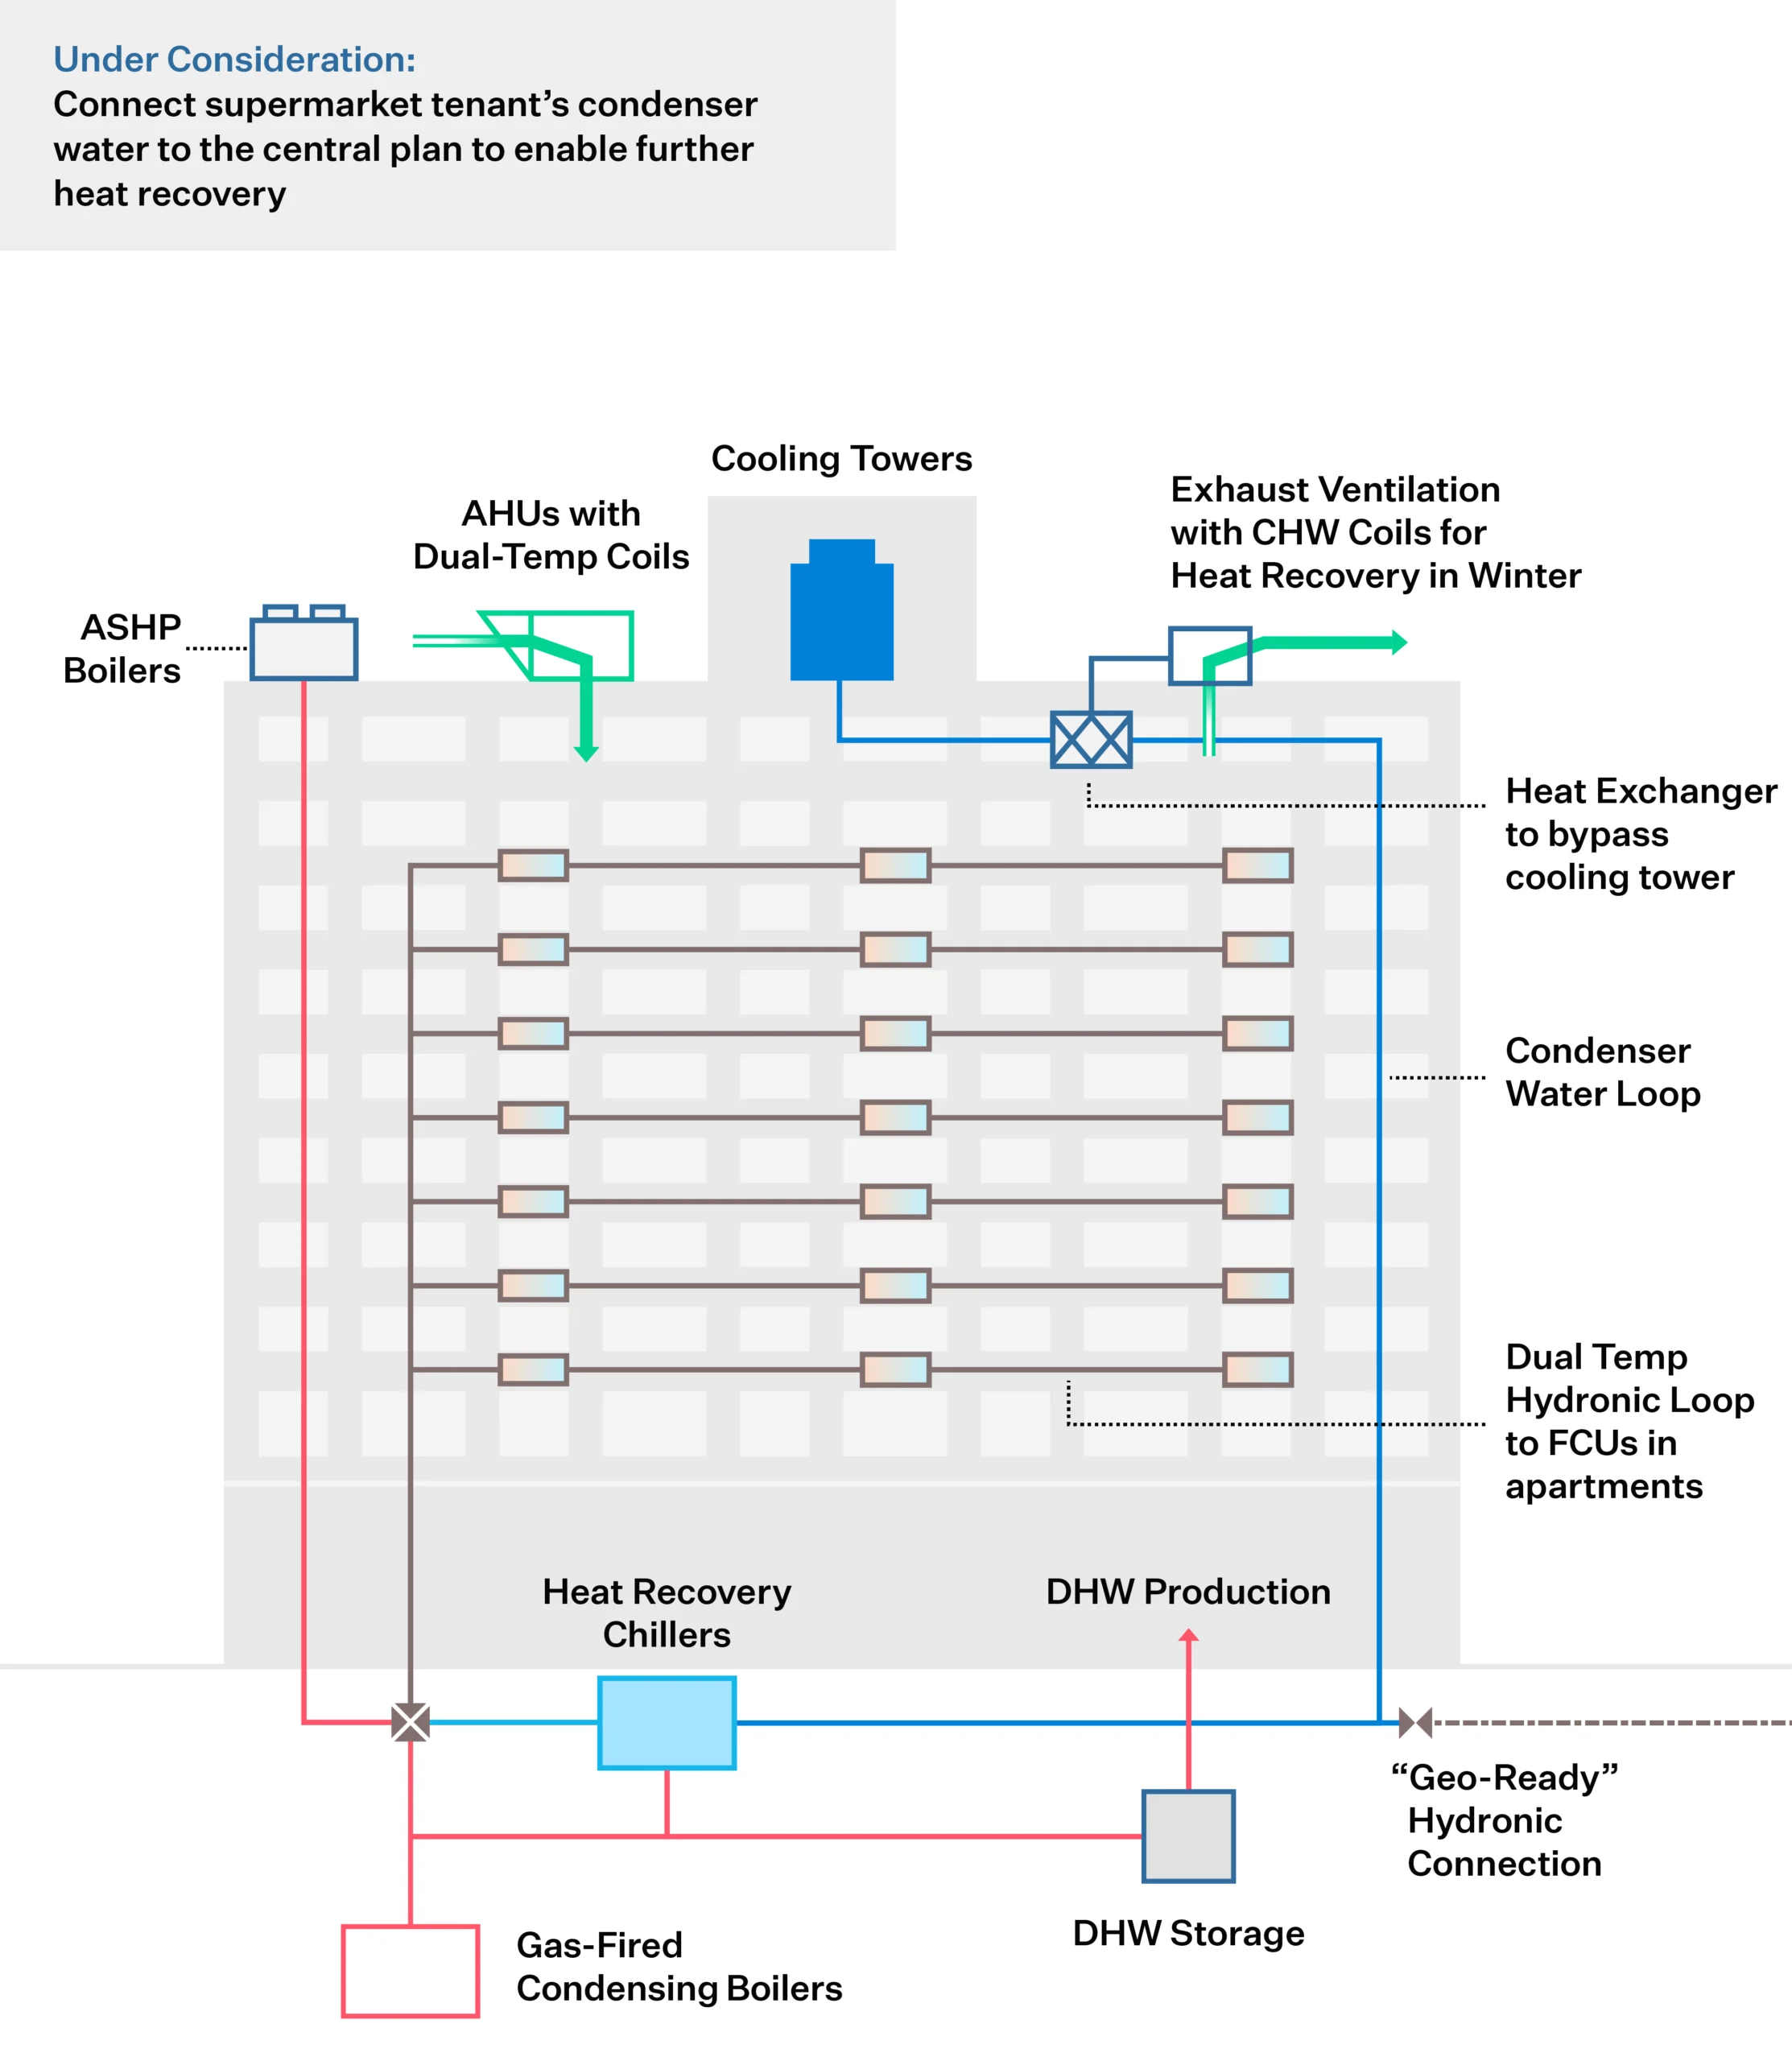
Step 2: Design Resource Efficient Solutions
Effective engineering integrates measures for reducing energy load, recovering wasted heat, and moving towards partial or full electrification. This increases operational efficiencies, optimizes energy peaks, and avoids oversized heating systems, thus alleviating space constraints and minimizing the cost of retrofits to decarbonize the building over time.
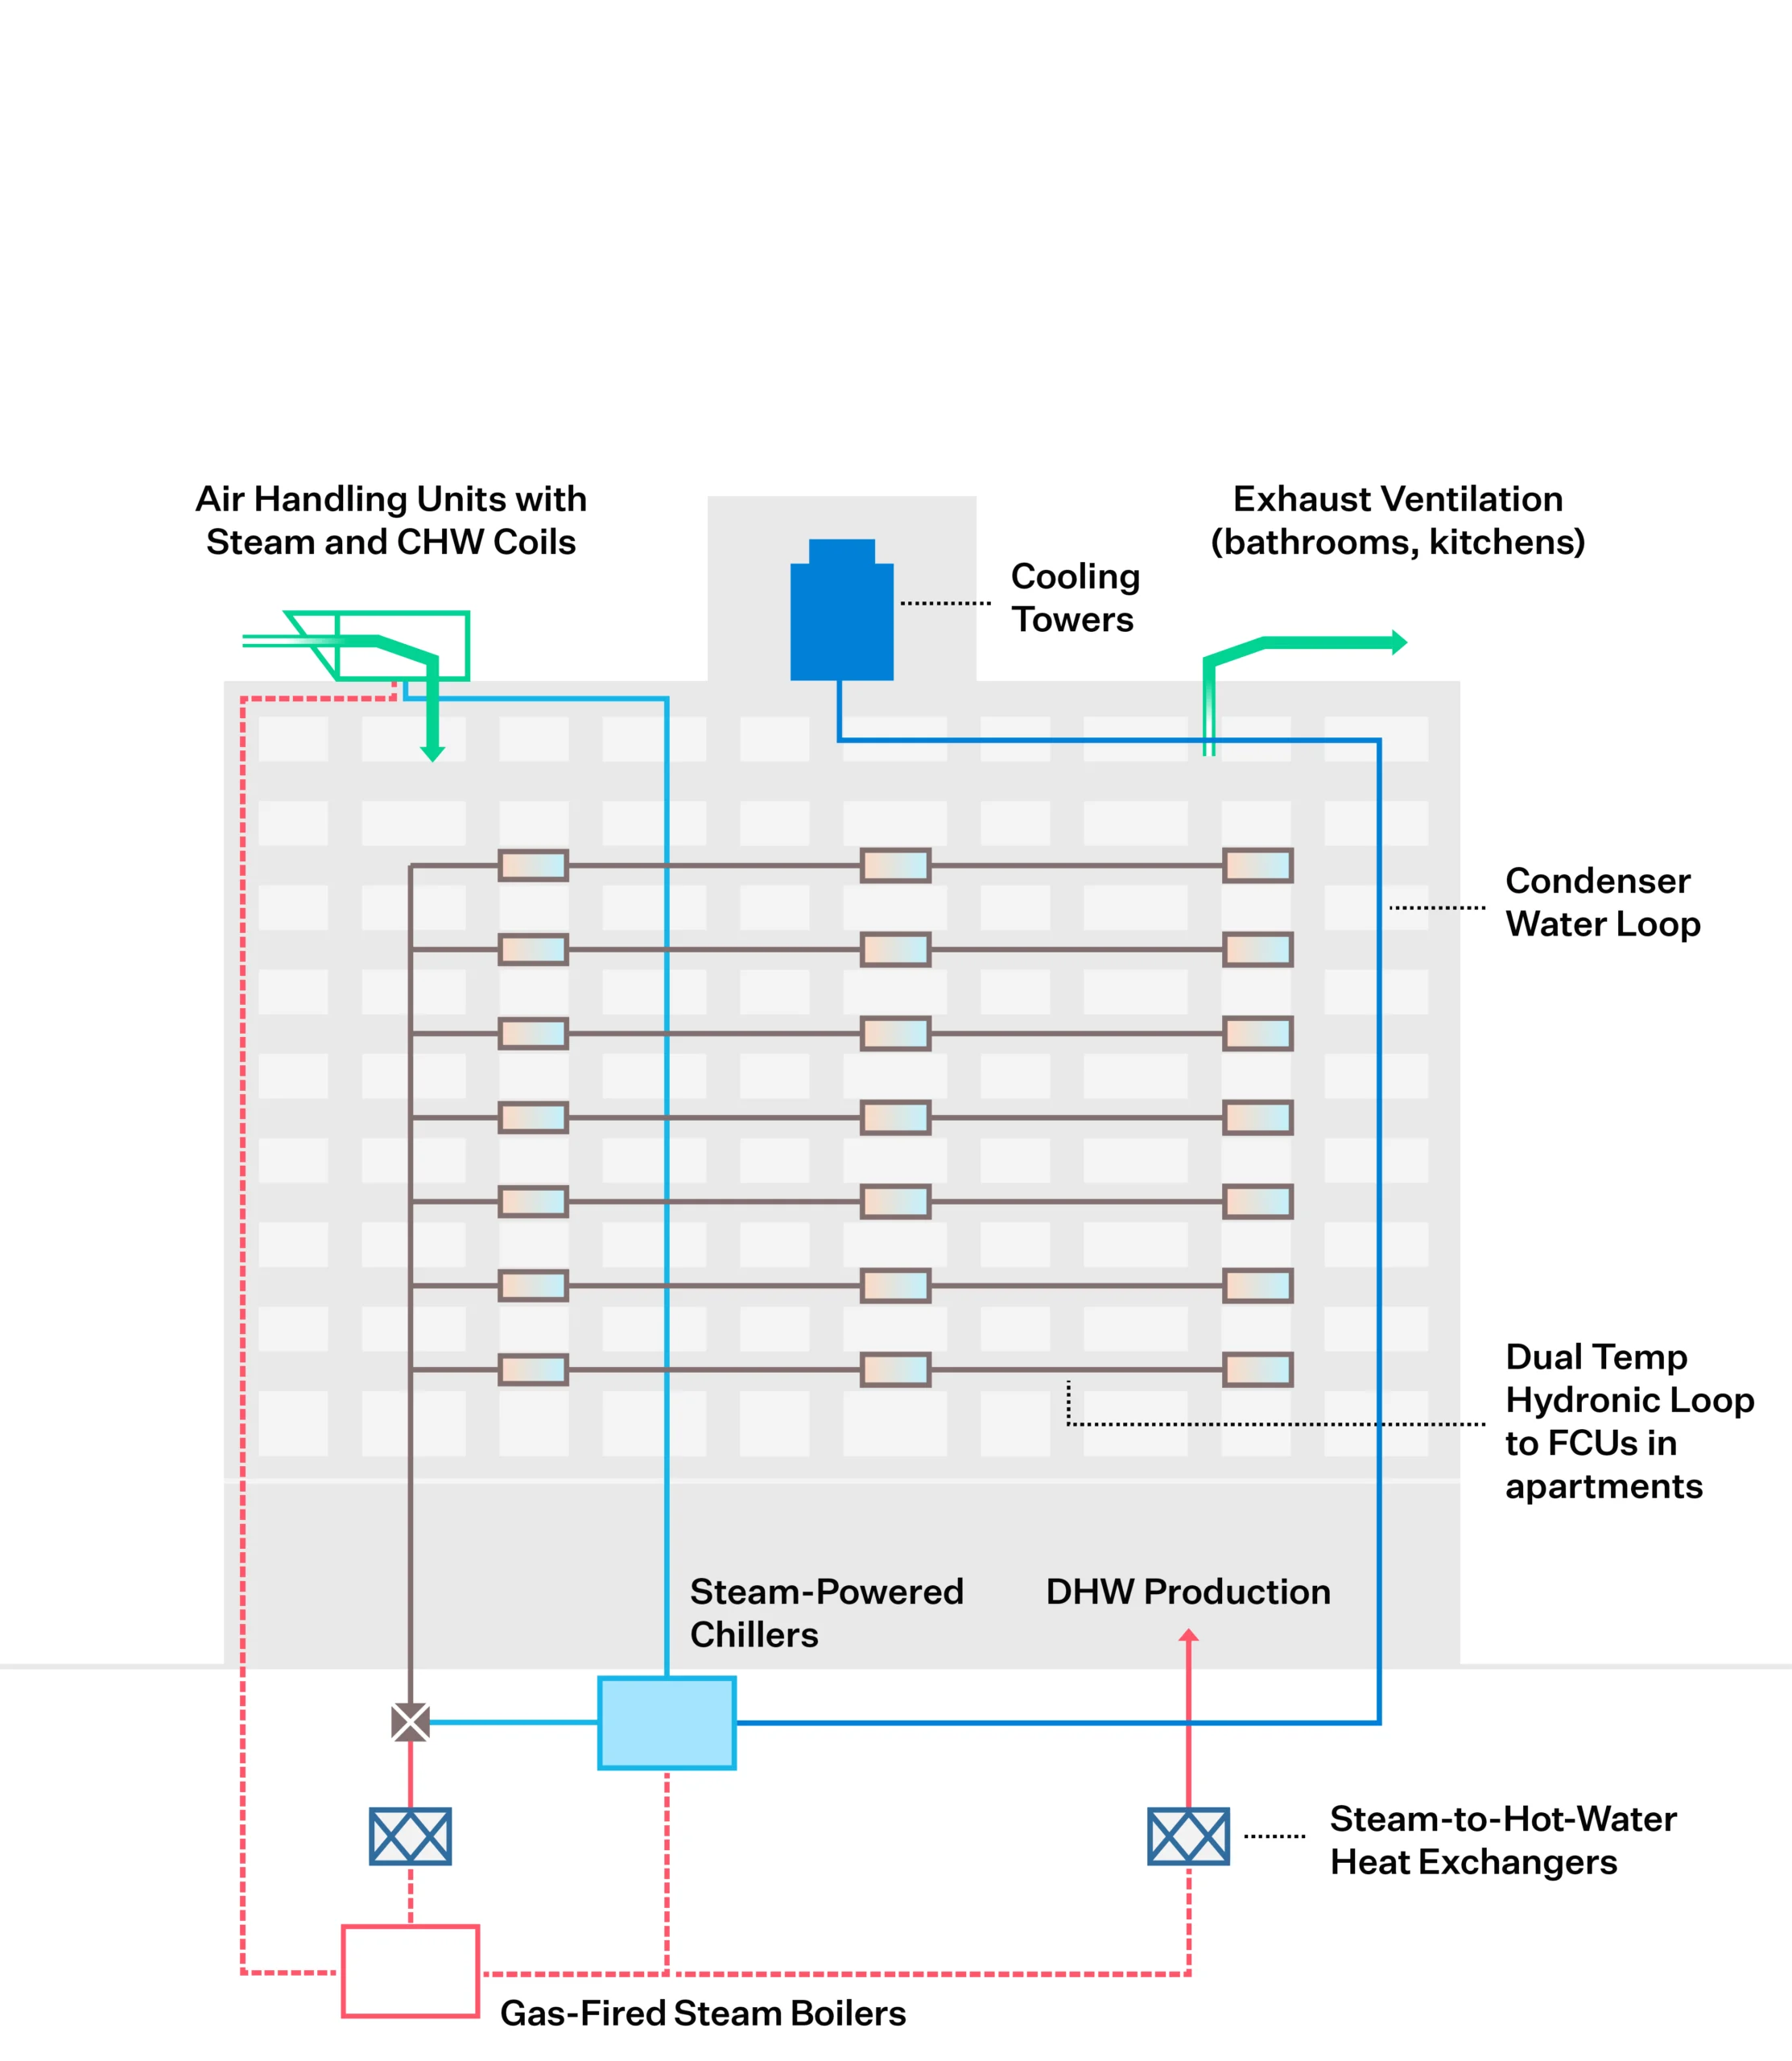
Existing Conditions
This diagram illustrates the building prior to the initiation of Strategic Decarbonization planning by the owners and their teams.
Click through the measures under “Building After” to understand the components of the building’s energy transition.
Sequence of Measures
2025
2026
2027
2028
2029
2030
Building System Affected
- heating
- cooling
- ventilation

Step 3
Step 3: Build the Business Case
Making a business case for strategic decarbonization requires thinking beyond a traditional energy audit approach or simple payback analysis. It assesses business-as-usual costs and risks against the costs and added value of phased decarbonization investments in the long-term.

Decarbonization Costs
$16M
Cost of ECM #1: 1.2M.
Cost of ECM #2: 14M.

Business-as-Usual Costs
$4.4M
Energy cost savings: 477k.
Repairs and maintenance savings: -150k.
BAU cost of system replacement/upgrades: 4.1M.
Business-as-Usual Risks
$2.7M
Local Law 97 or other regulatory fines:
2030-2034: 294k.
2035-2039: 483k.
2040-2049: 668k.
2050+: 1.2M.

Decarbonization Value
$3M
Incentives: 3M.

Net Present Value
$3.7M
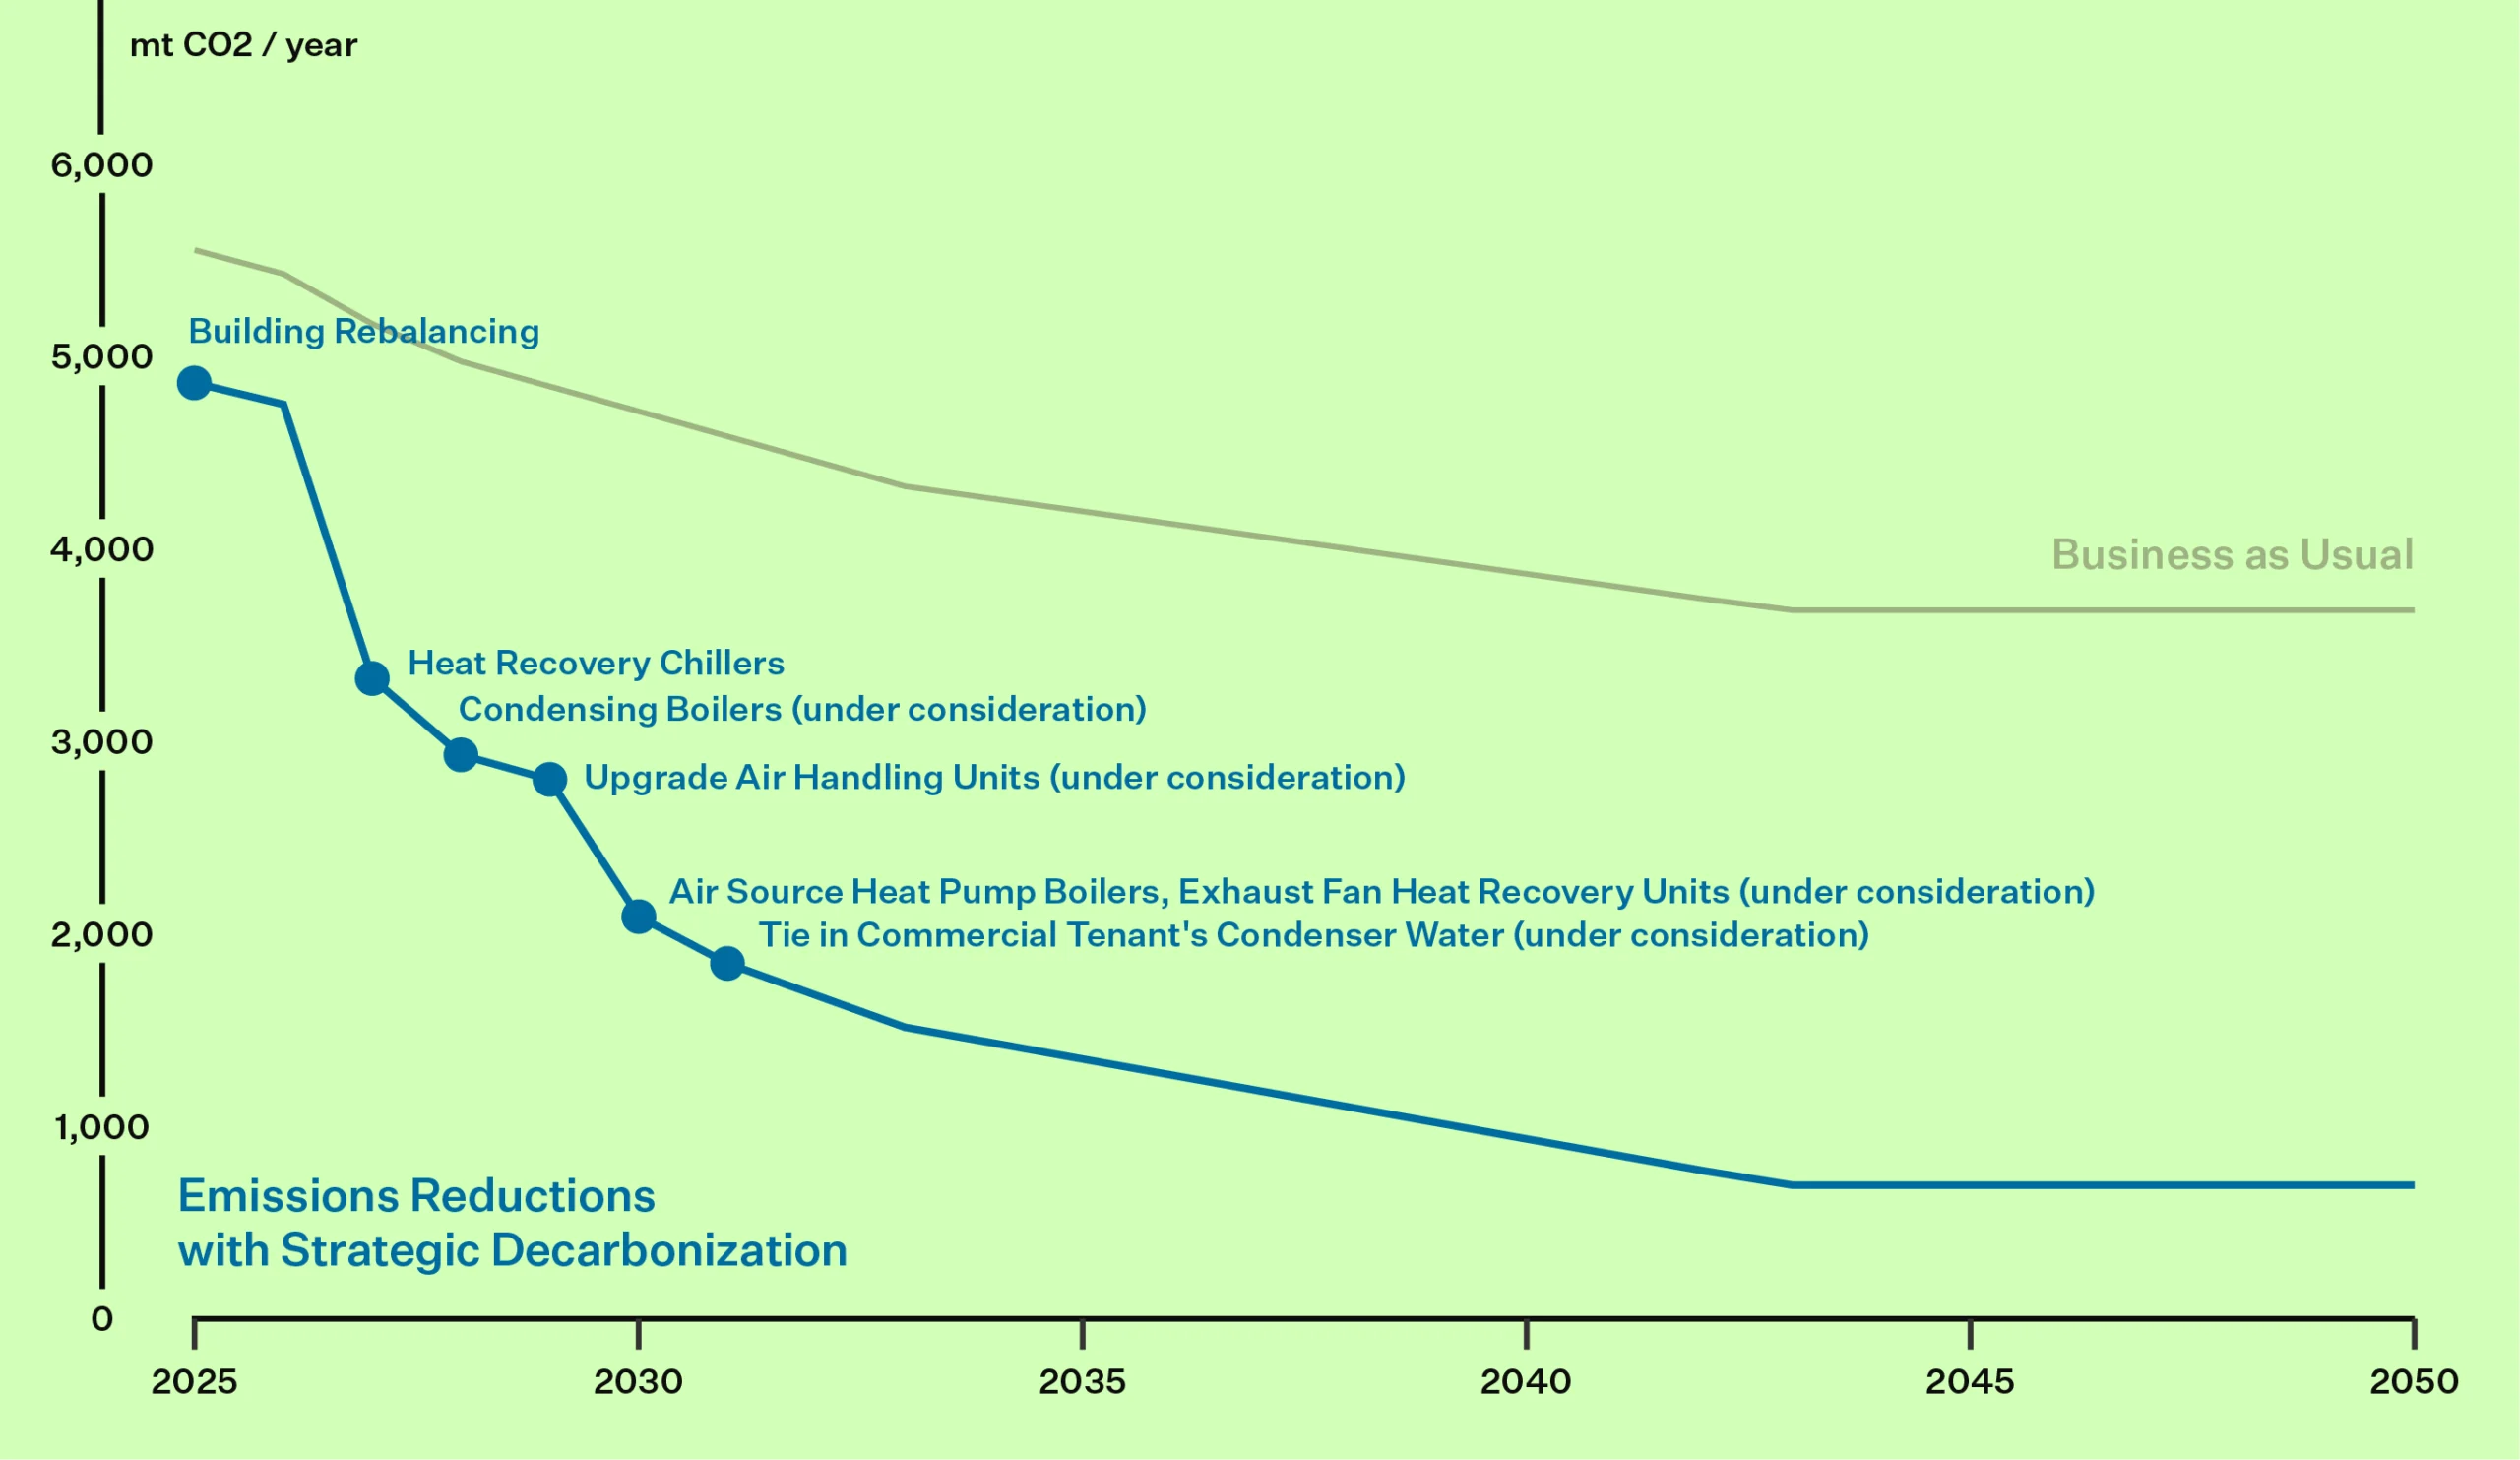
Strategic Decarbonization Action Plan
An emissions decarbonization roadmap helps building owners visualize their future emissions reductions by outlining the CO2 reductions from selected energy conservation measures. This roadmap is designed with a phased approach, considering a 20- or 30-year timeline, and incorporates the evolving benefits of grid decarbonization, ensuring a comprehensive view of long-term environmental impact.
More Like This
Case Study
NYSERDA supported
Case Study
The Victory
Energy conservation analysis at midtown tower
Energy conservation analysis at midtown tower

Case Study
Case Study
The Towers
Oldest US multifamily co-op transforms wastewater into clean energy