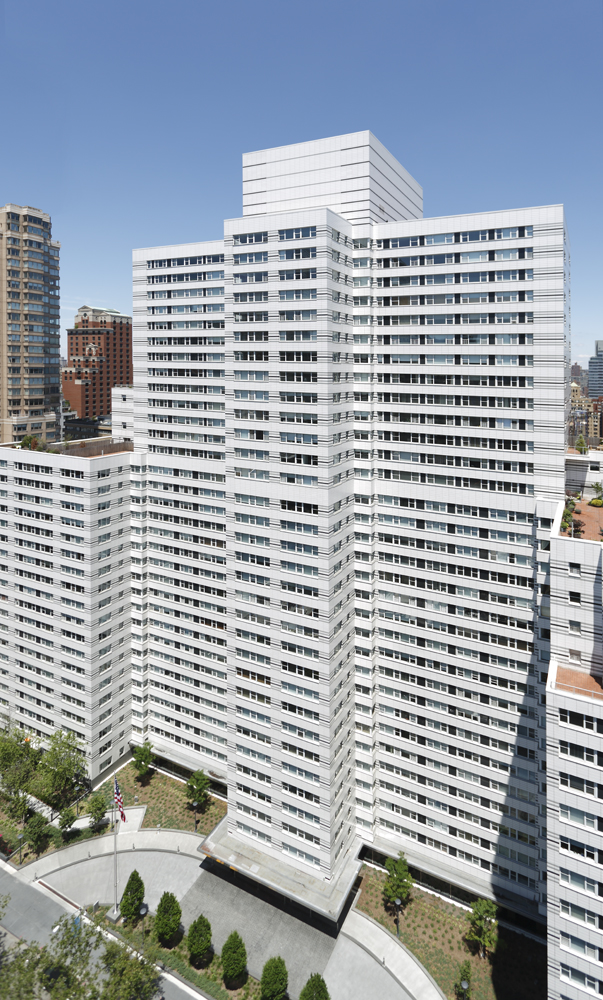
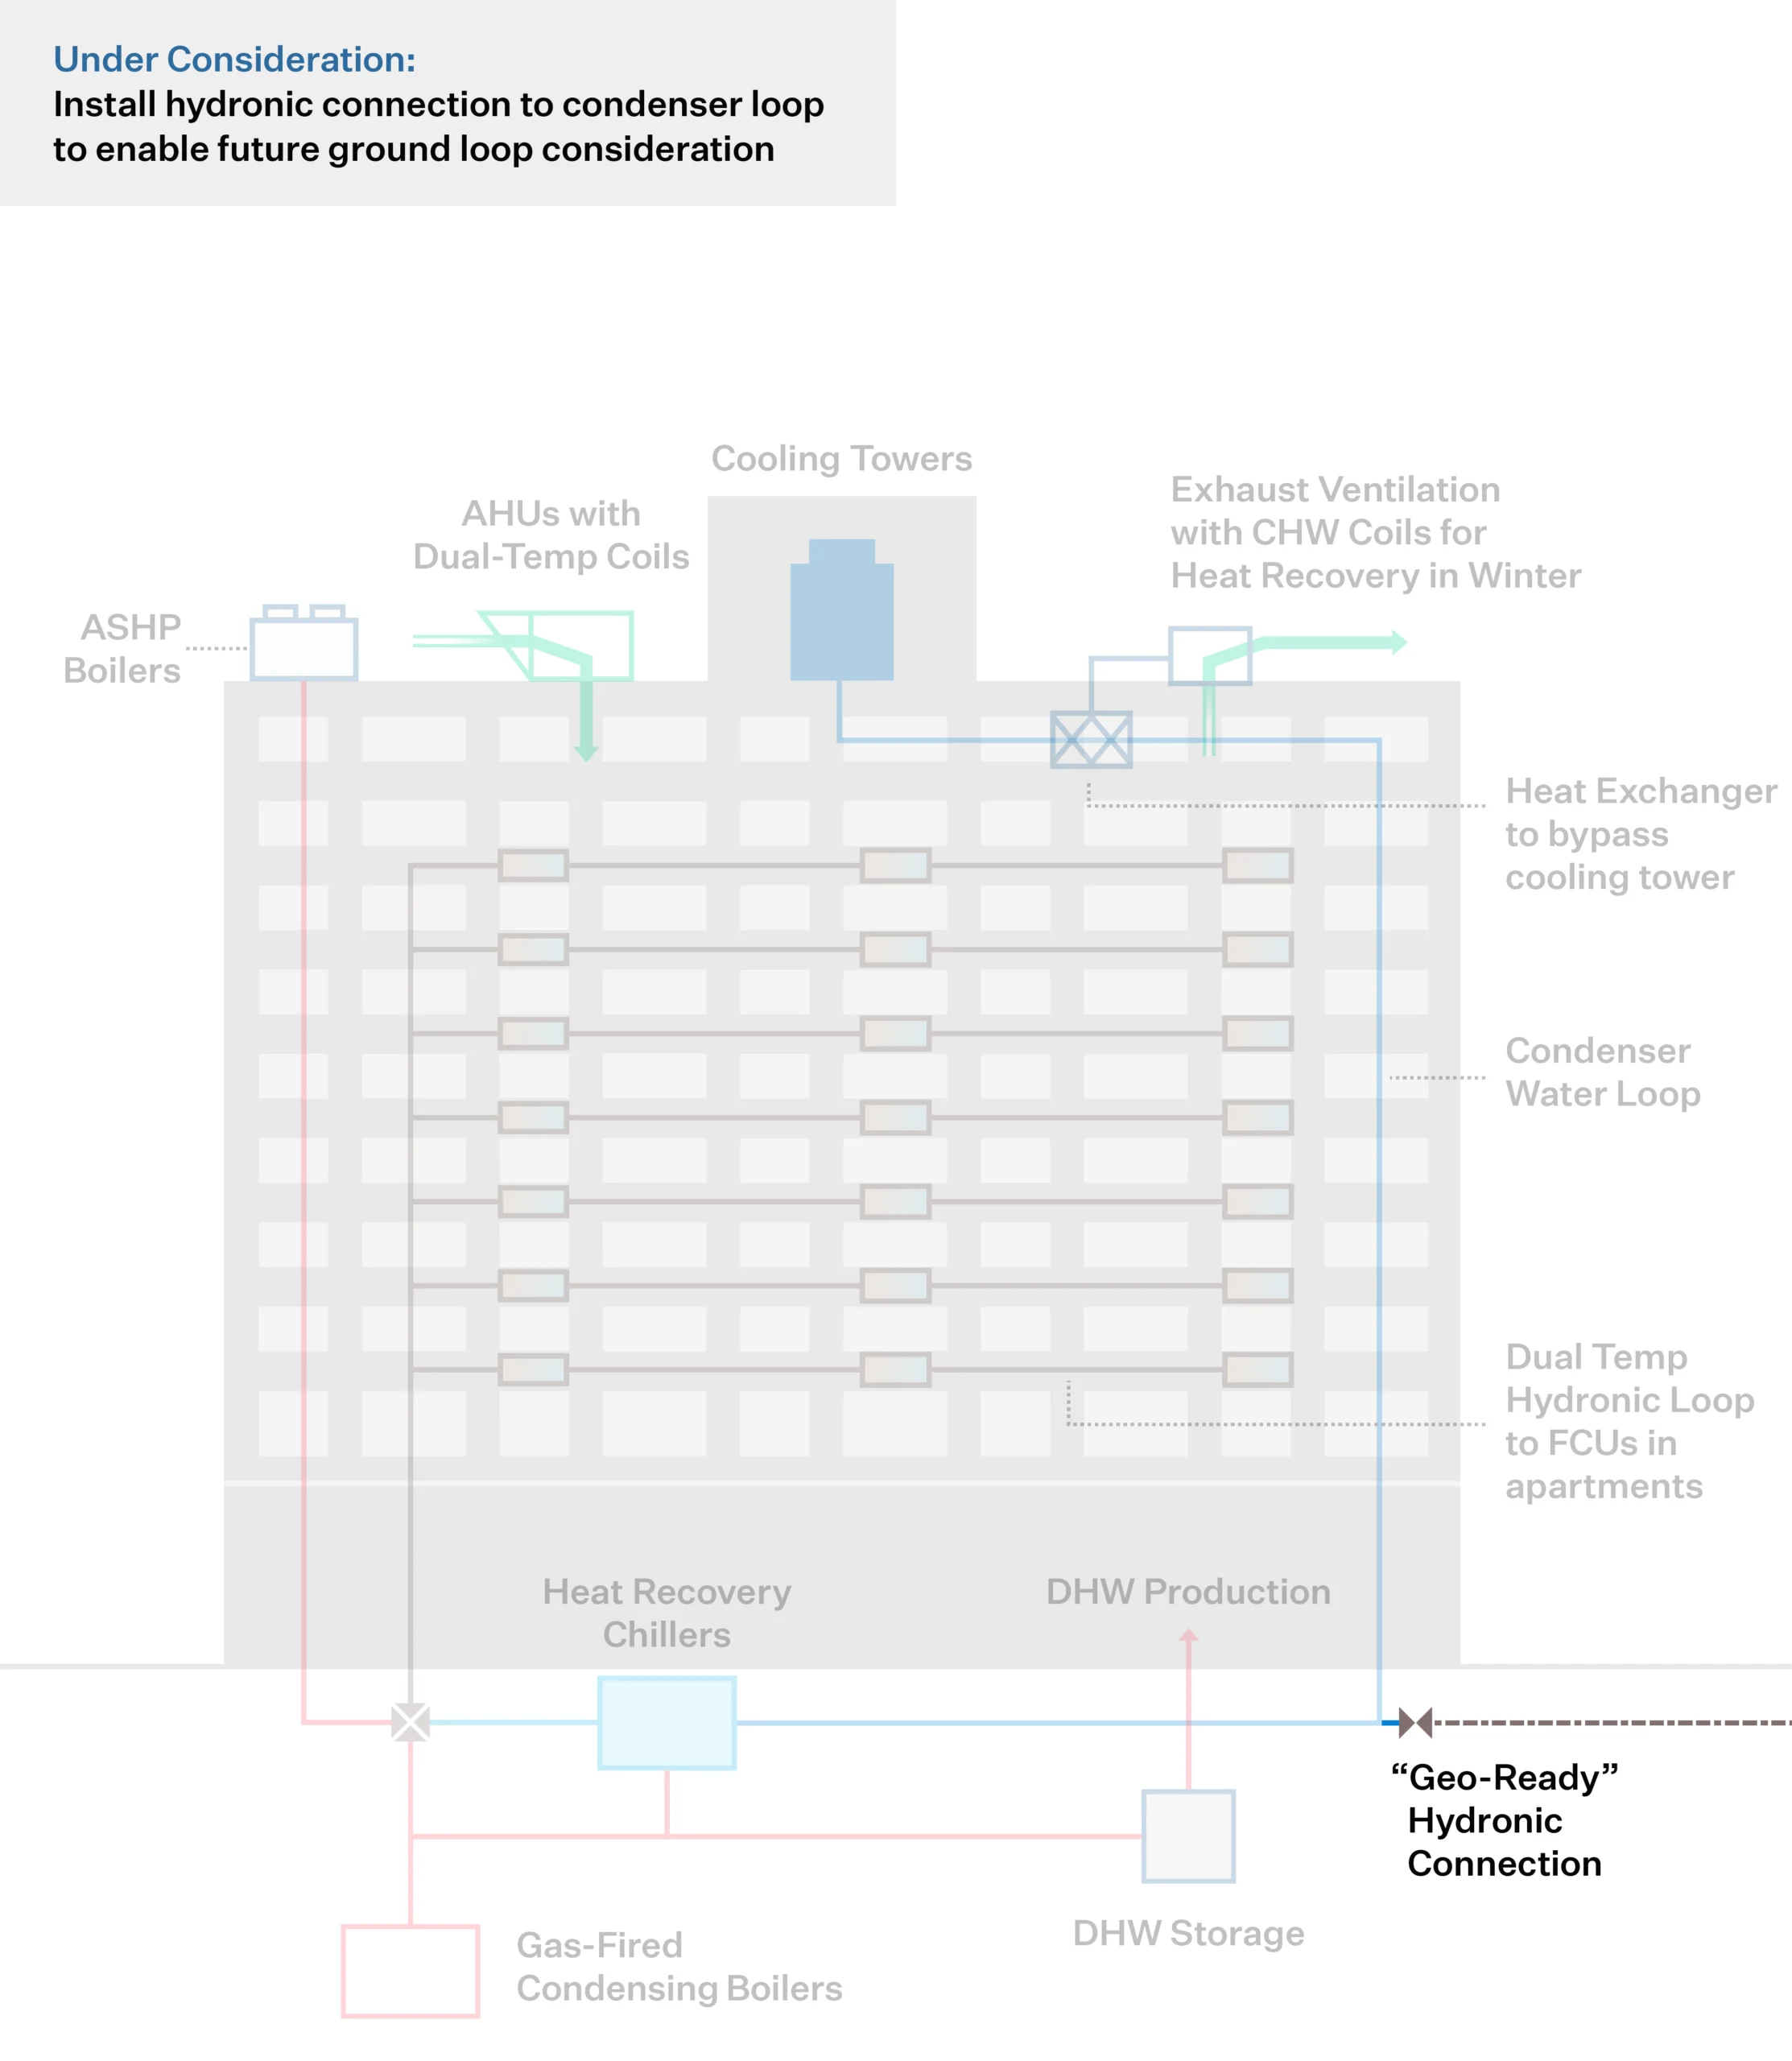
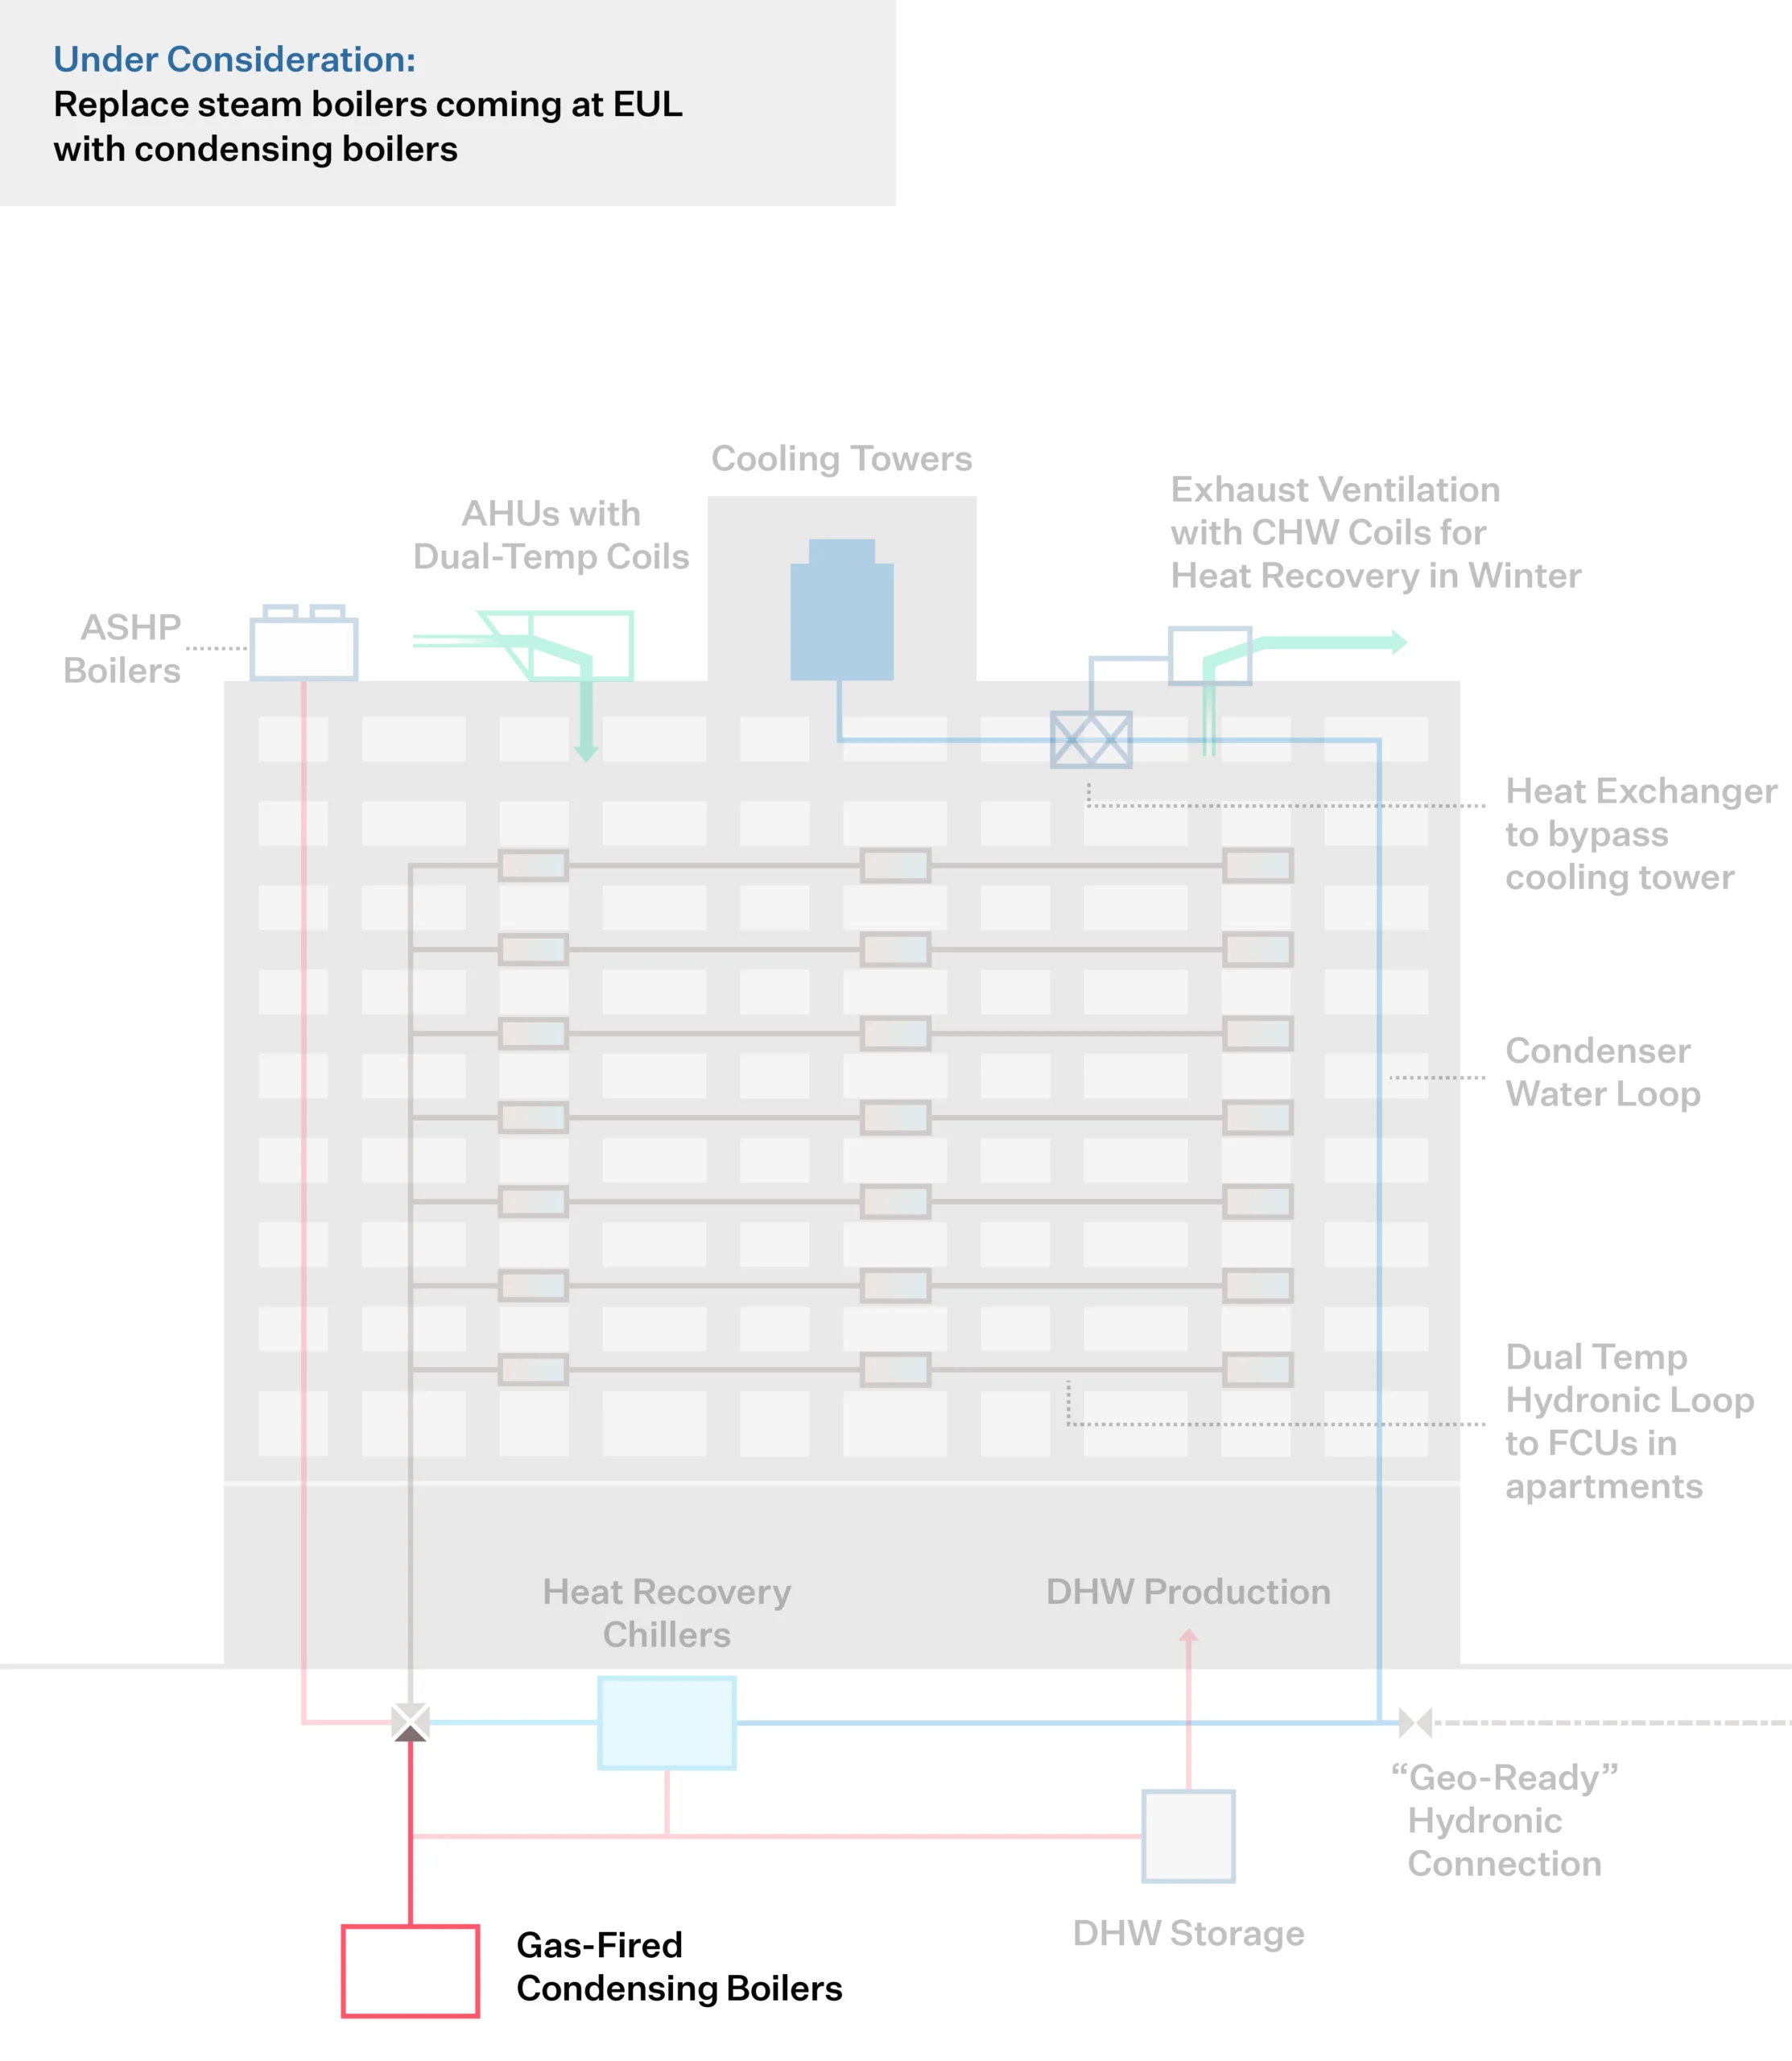
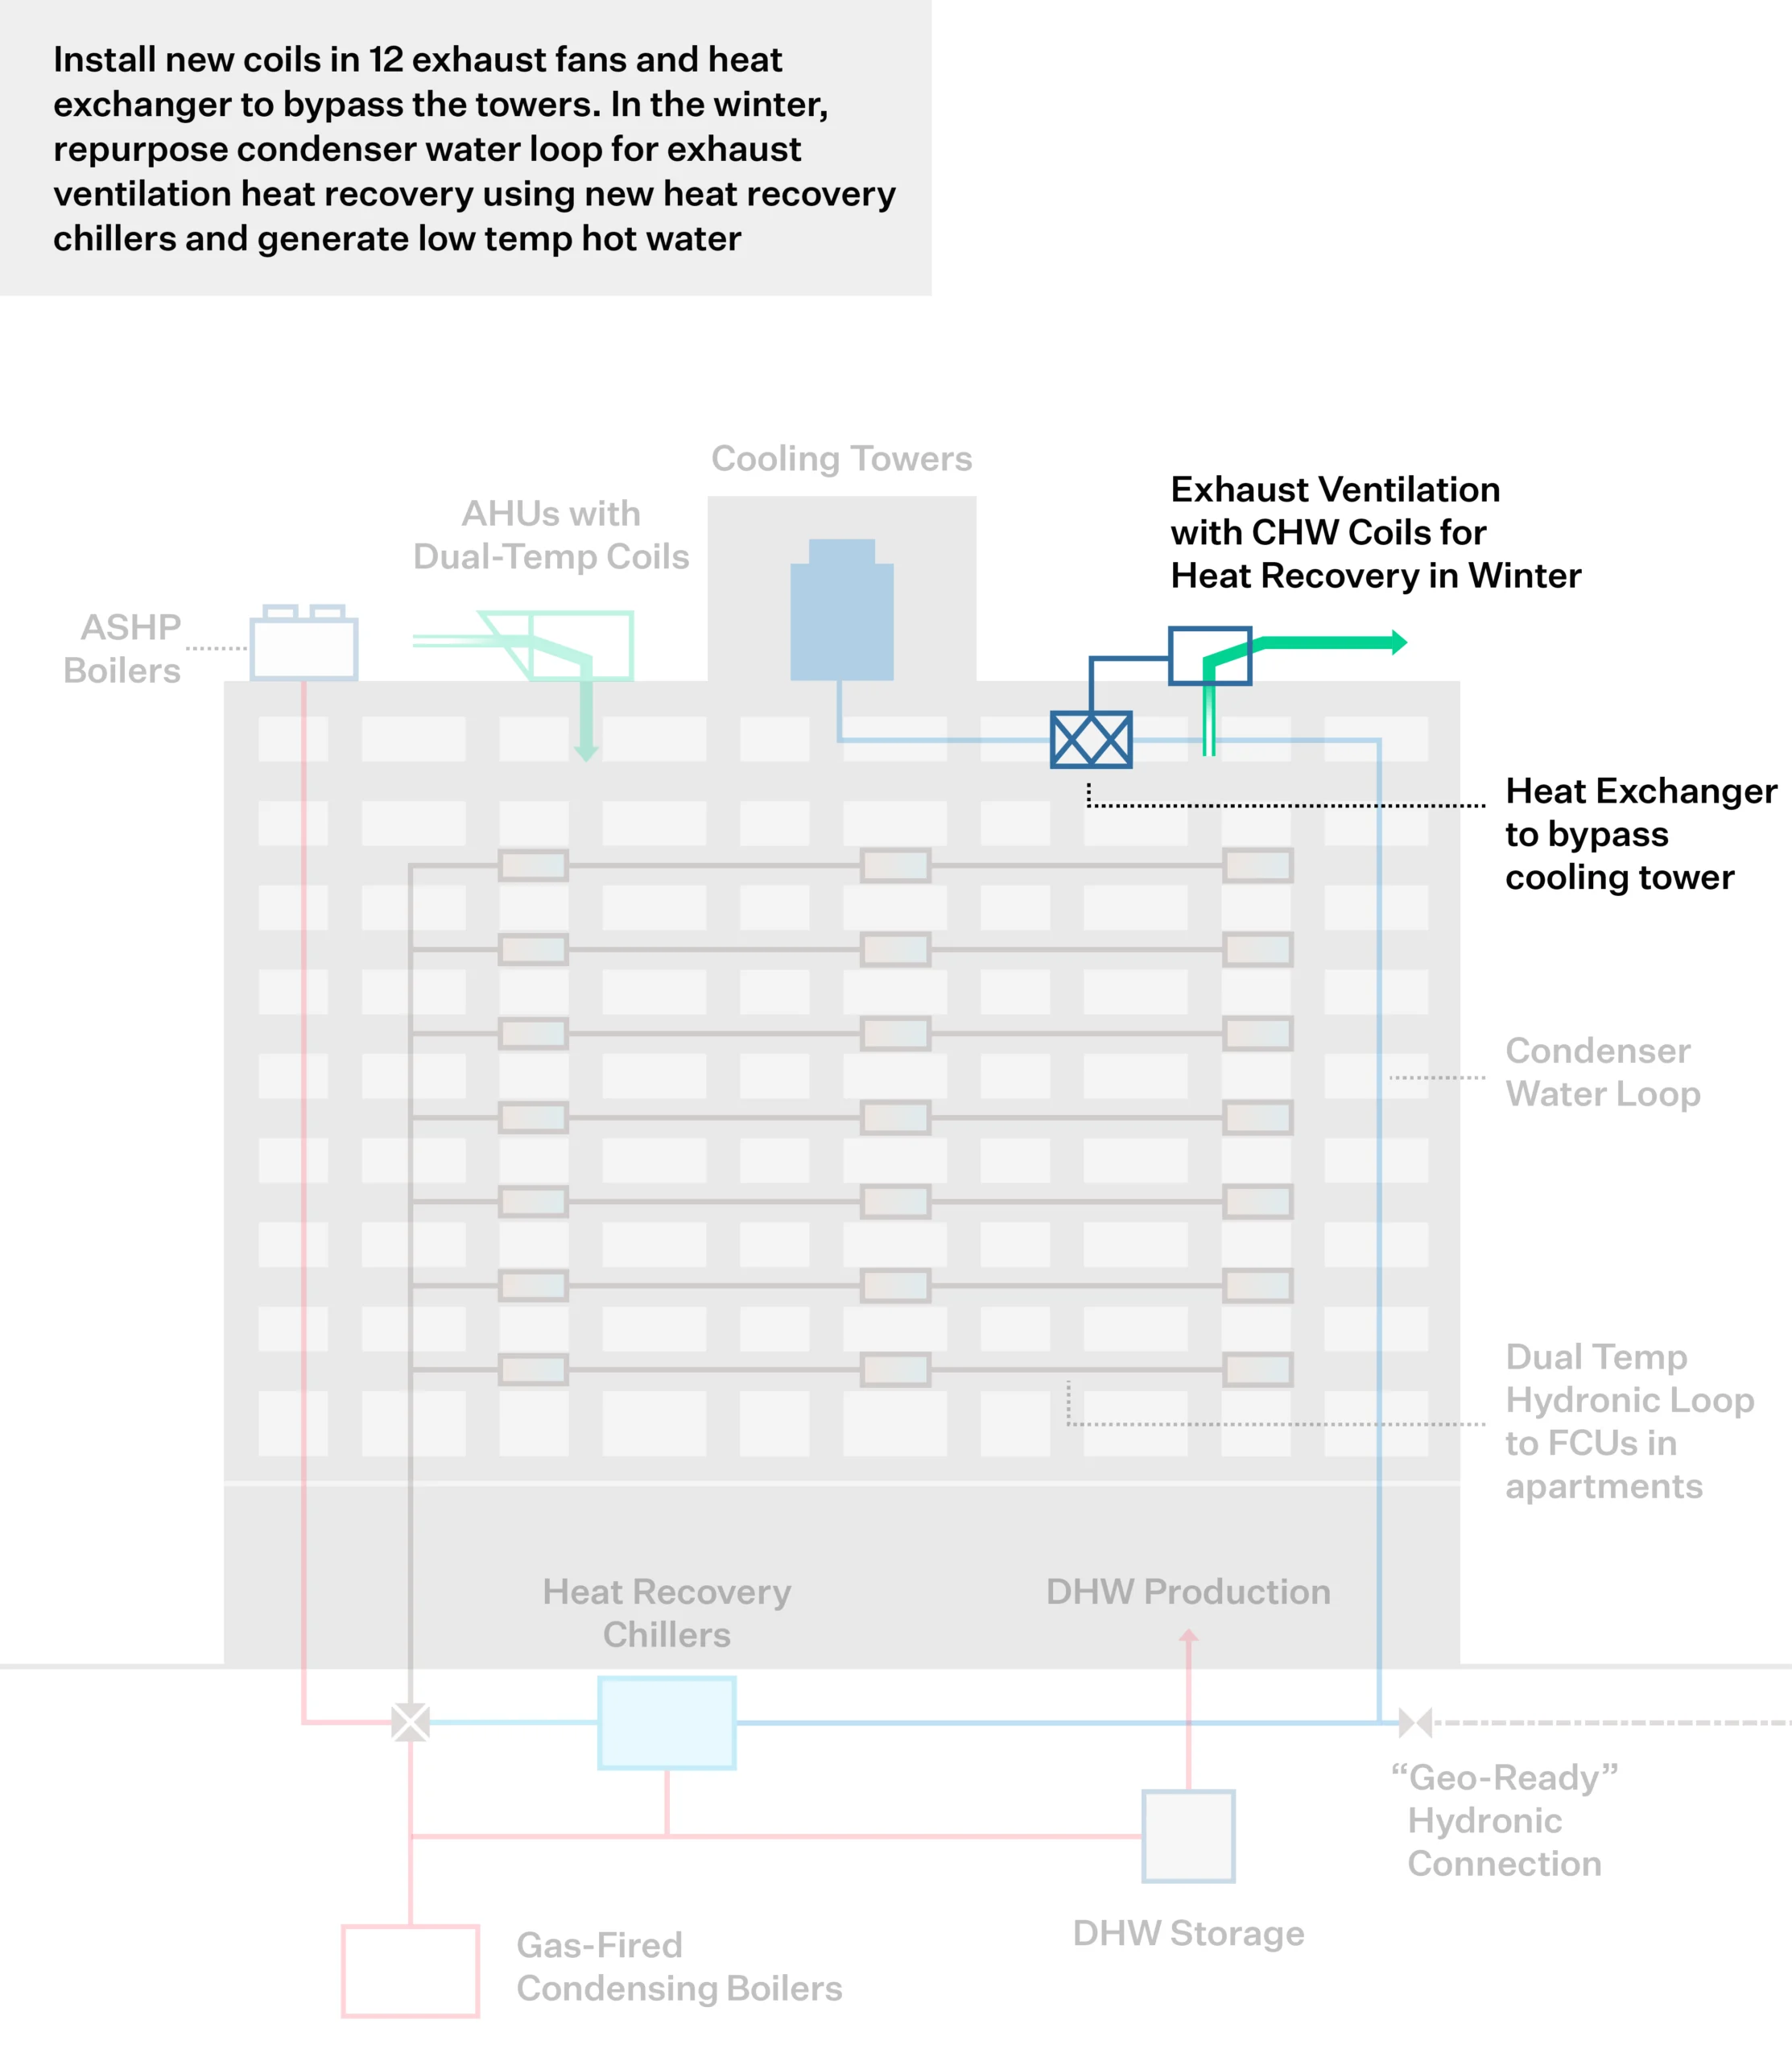
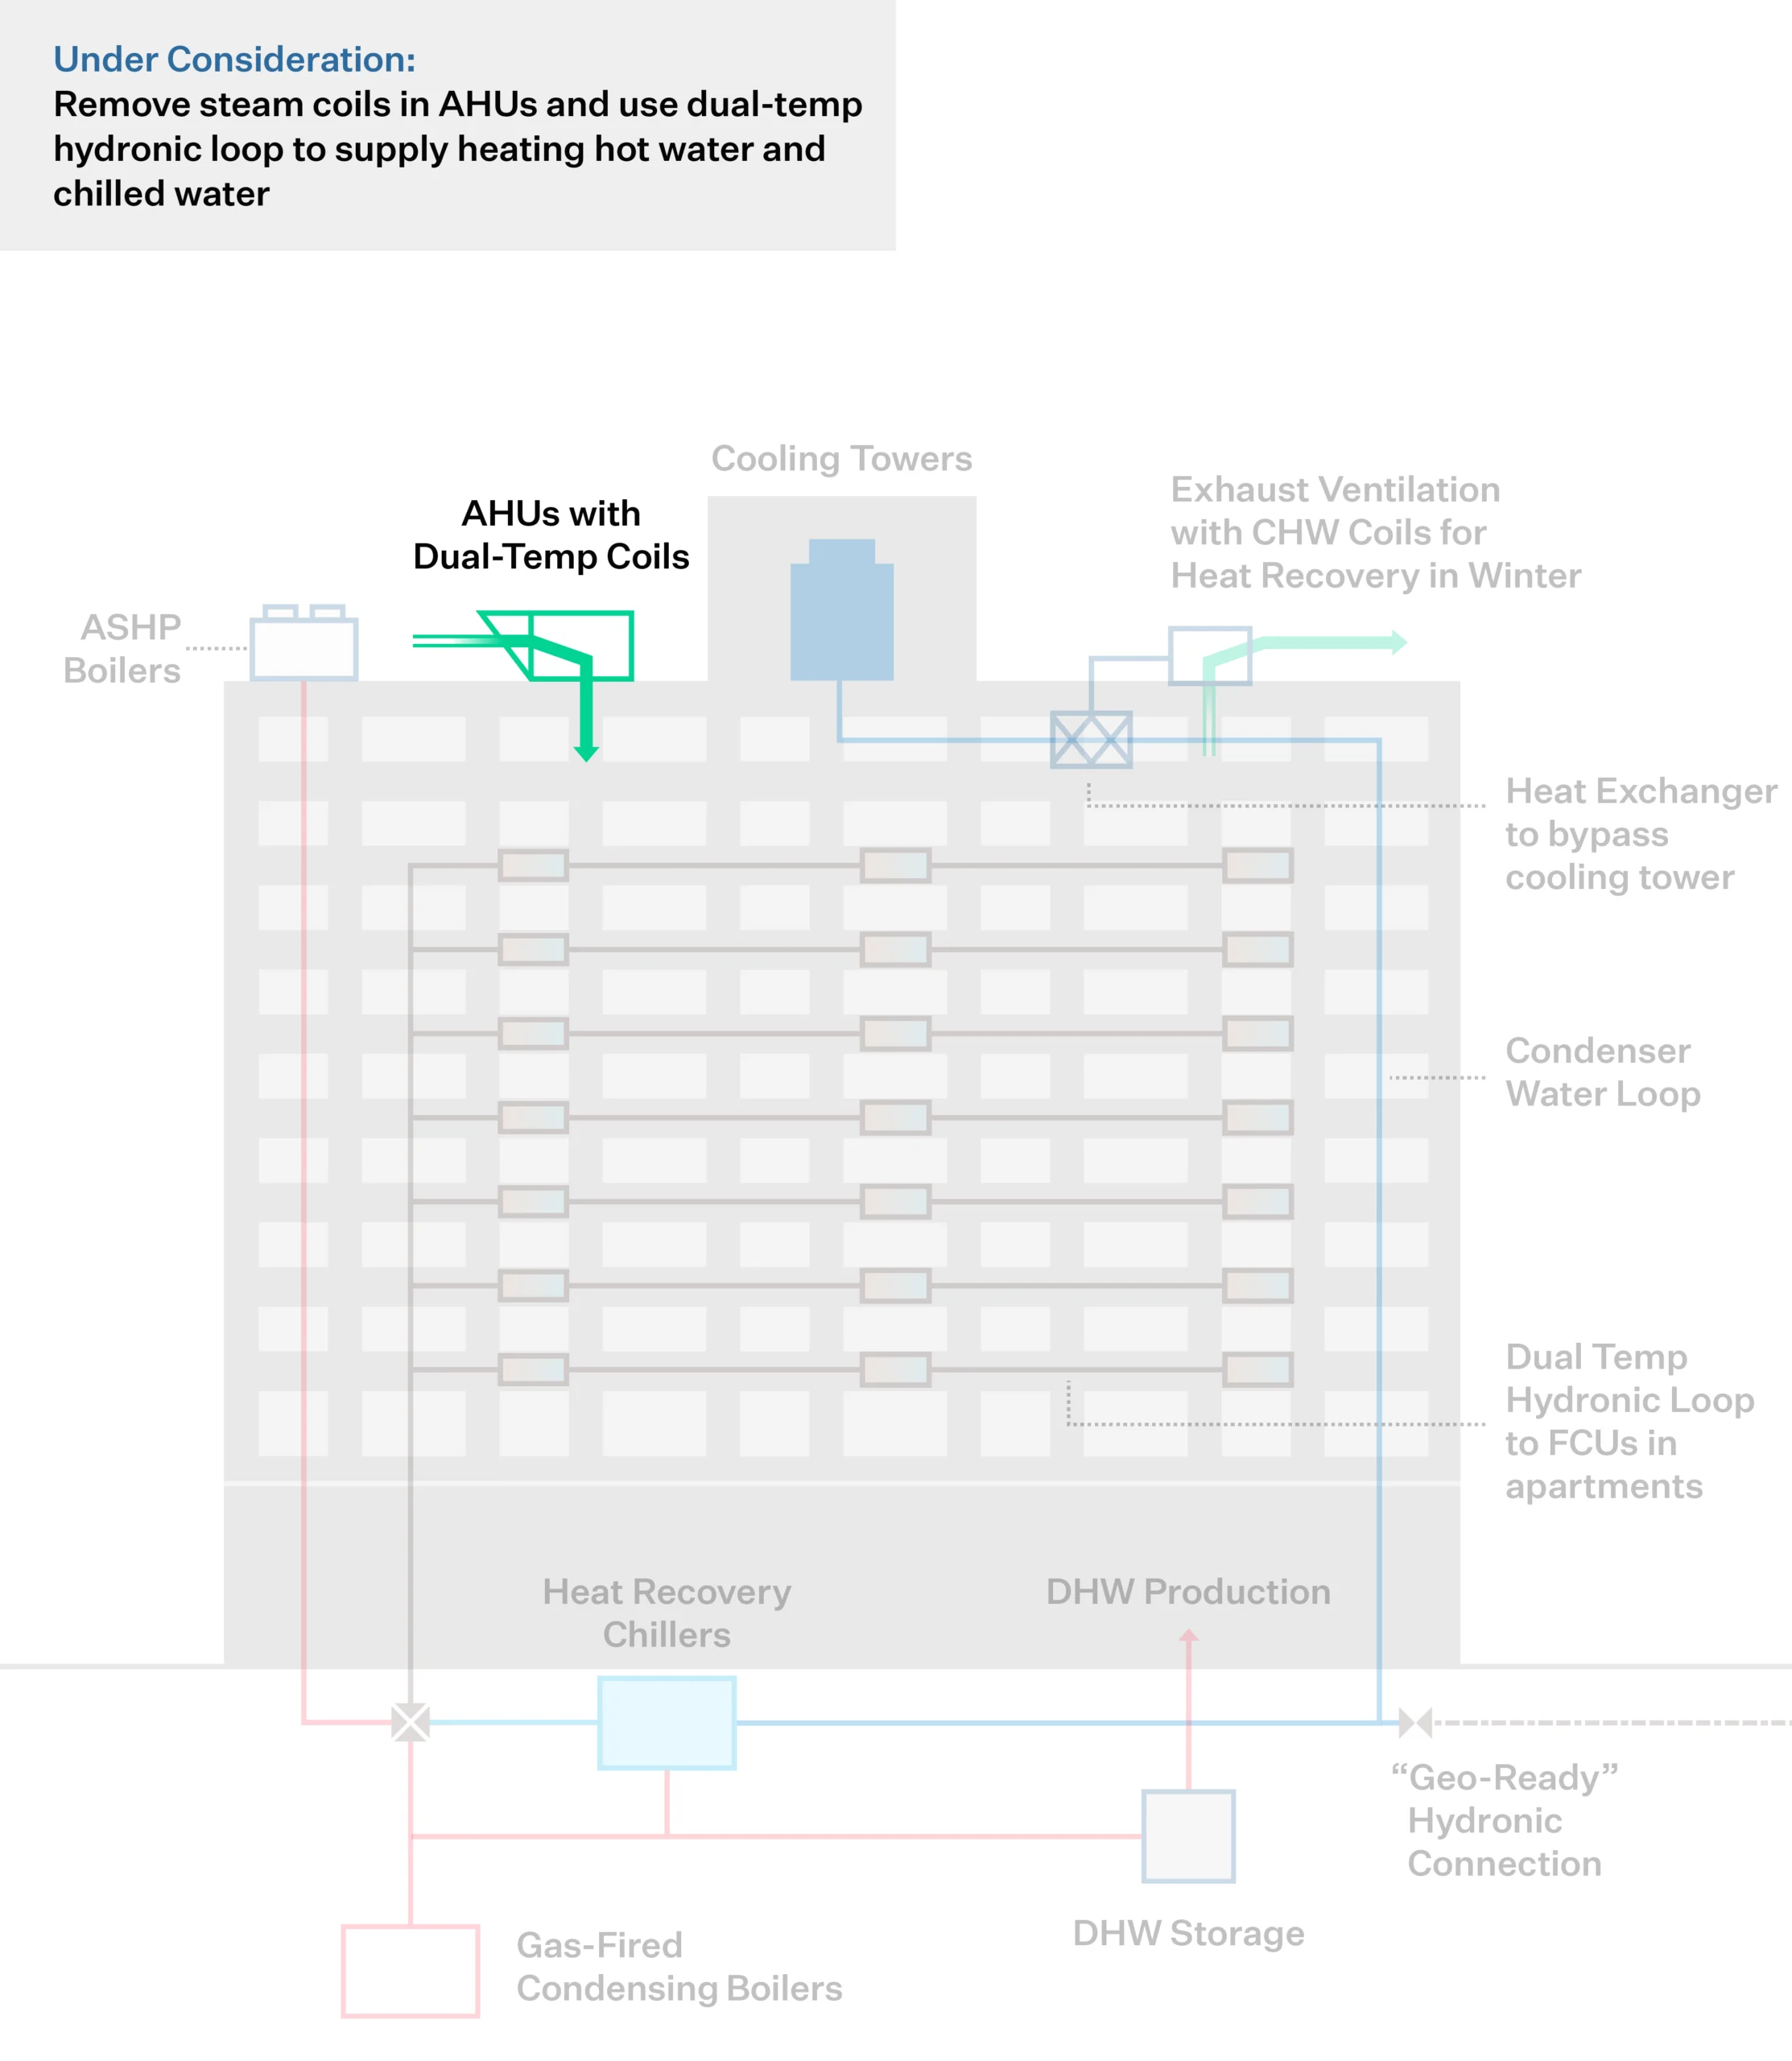
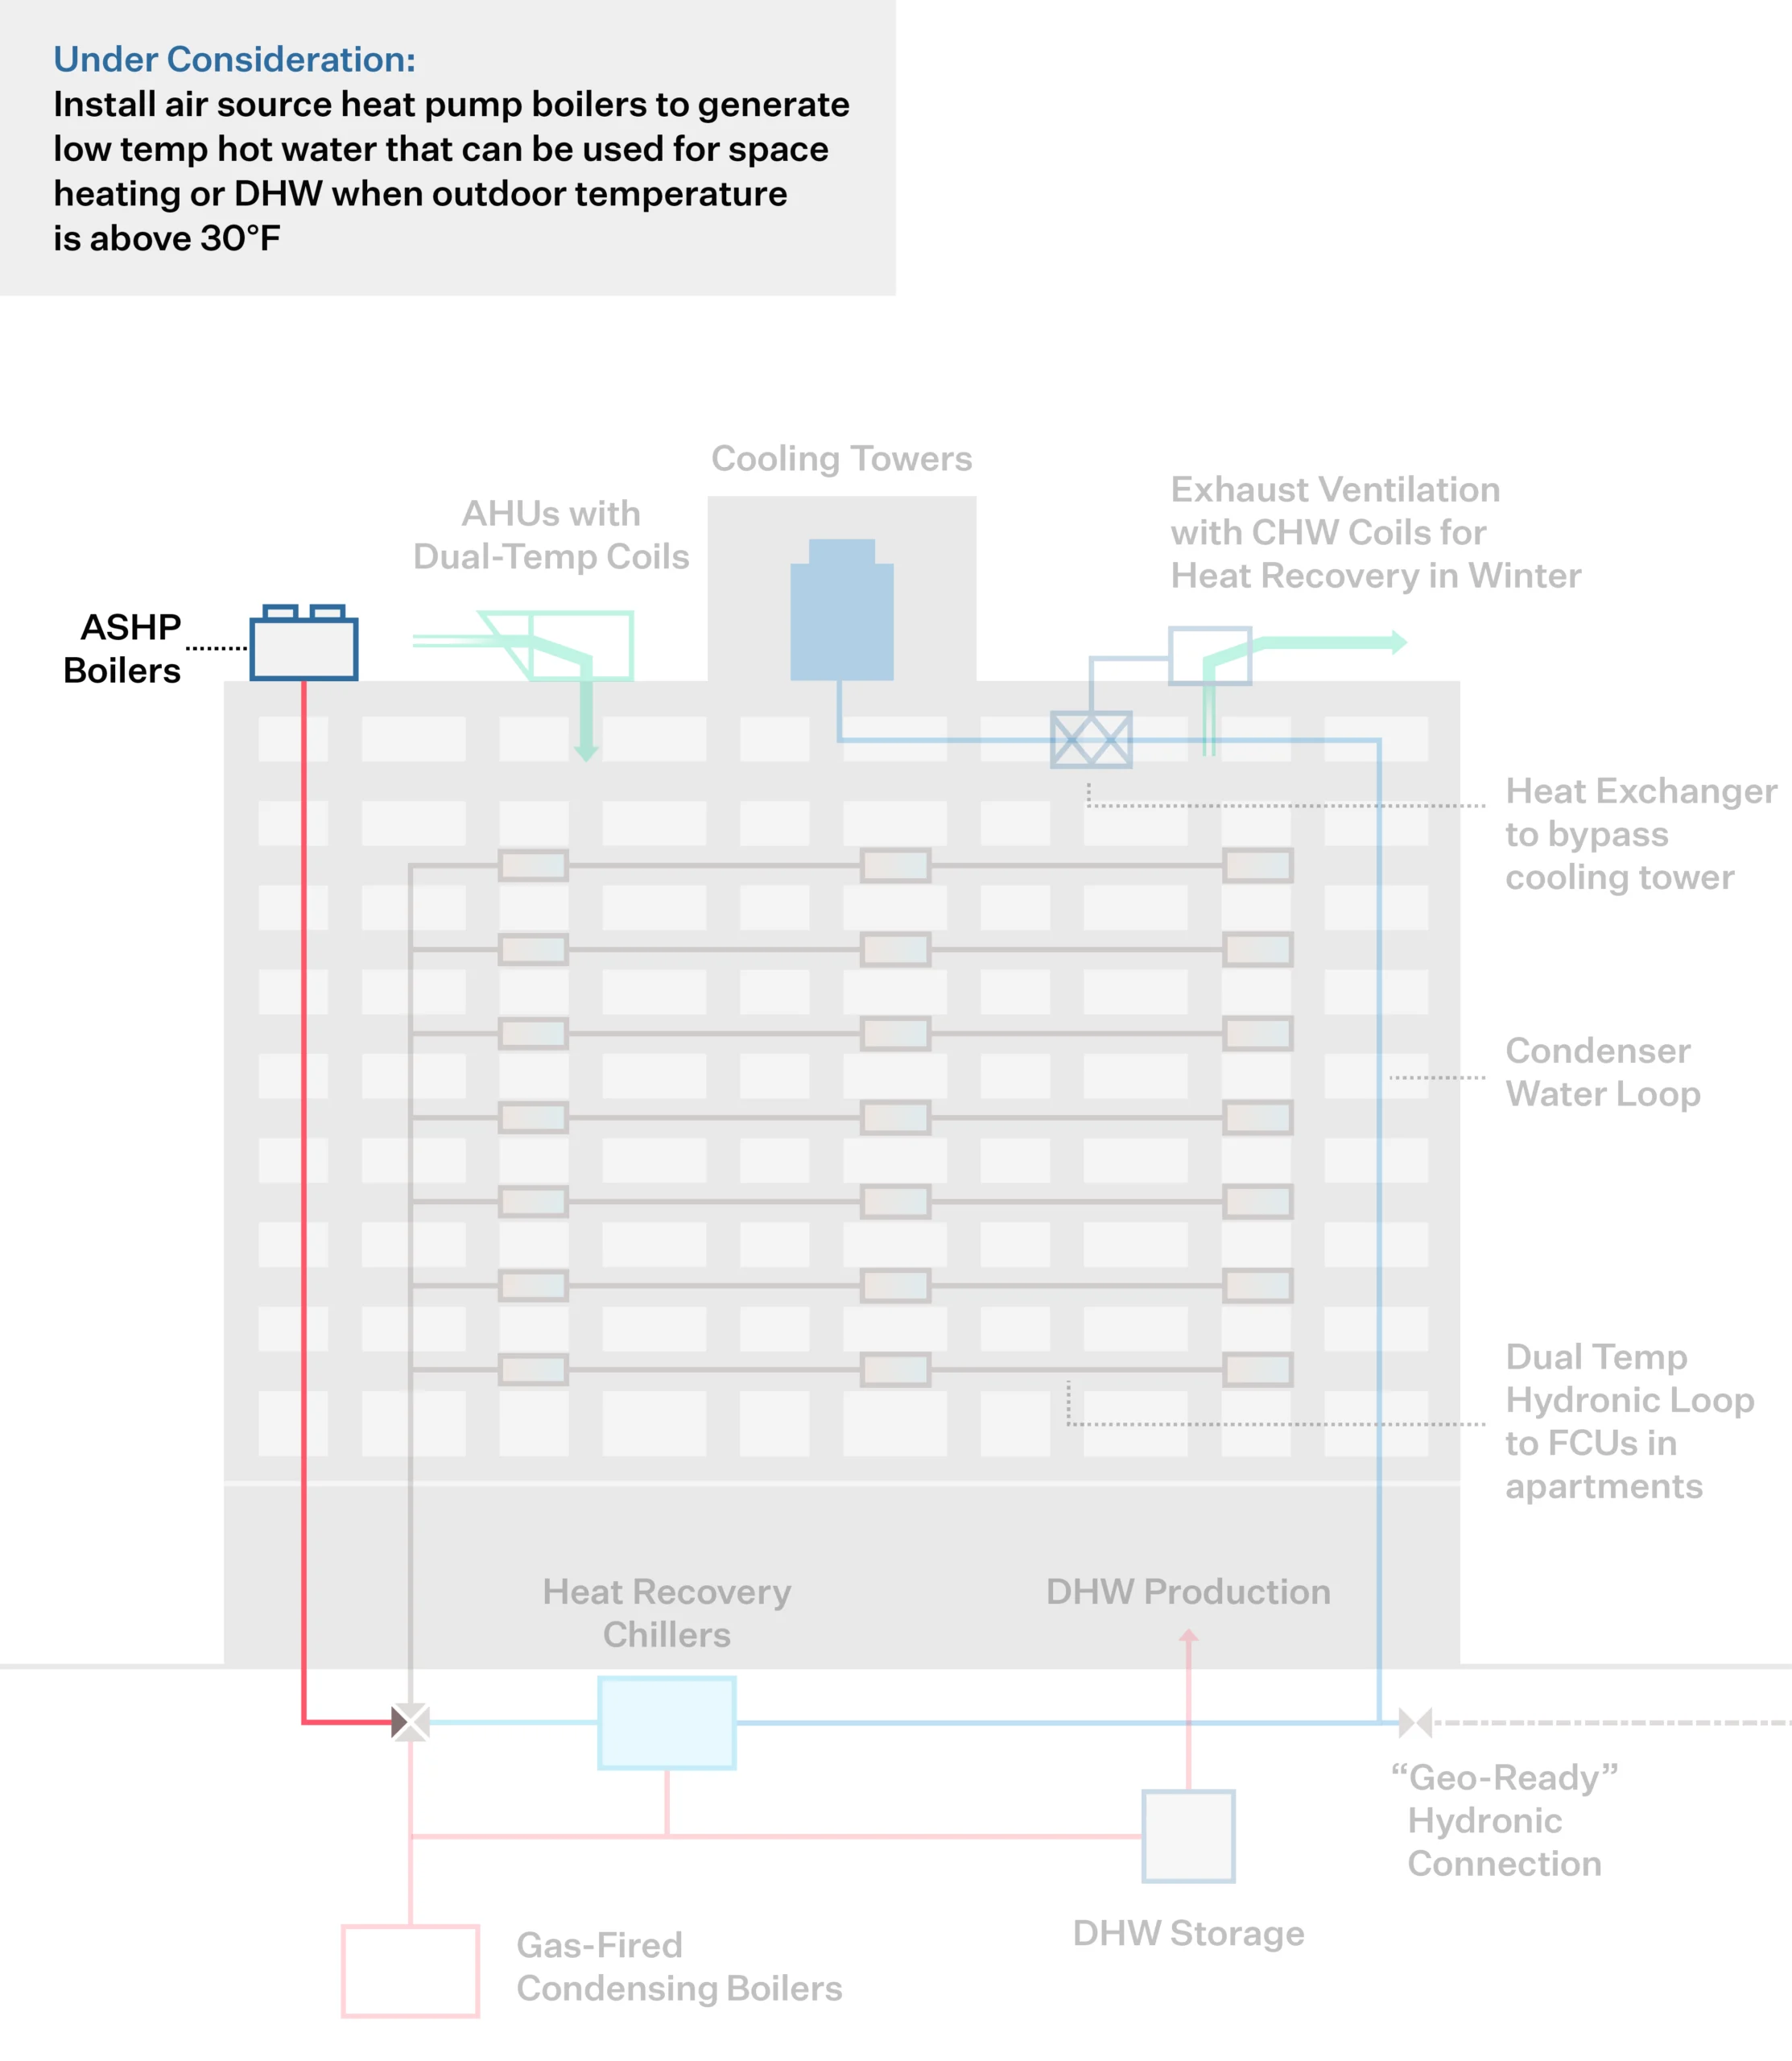
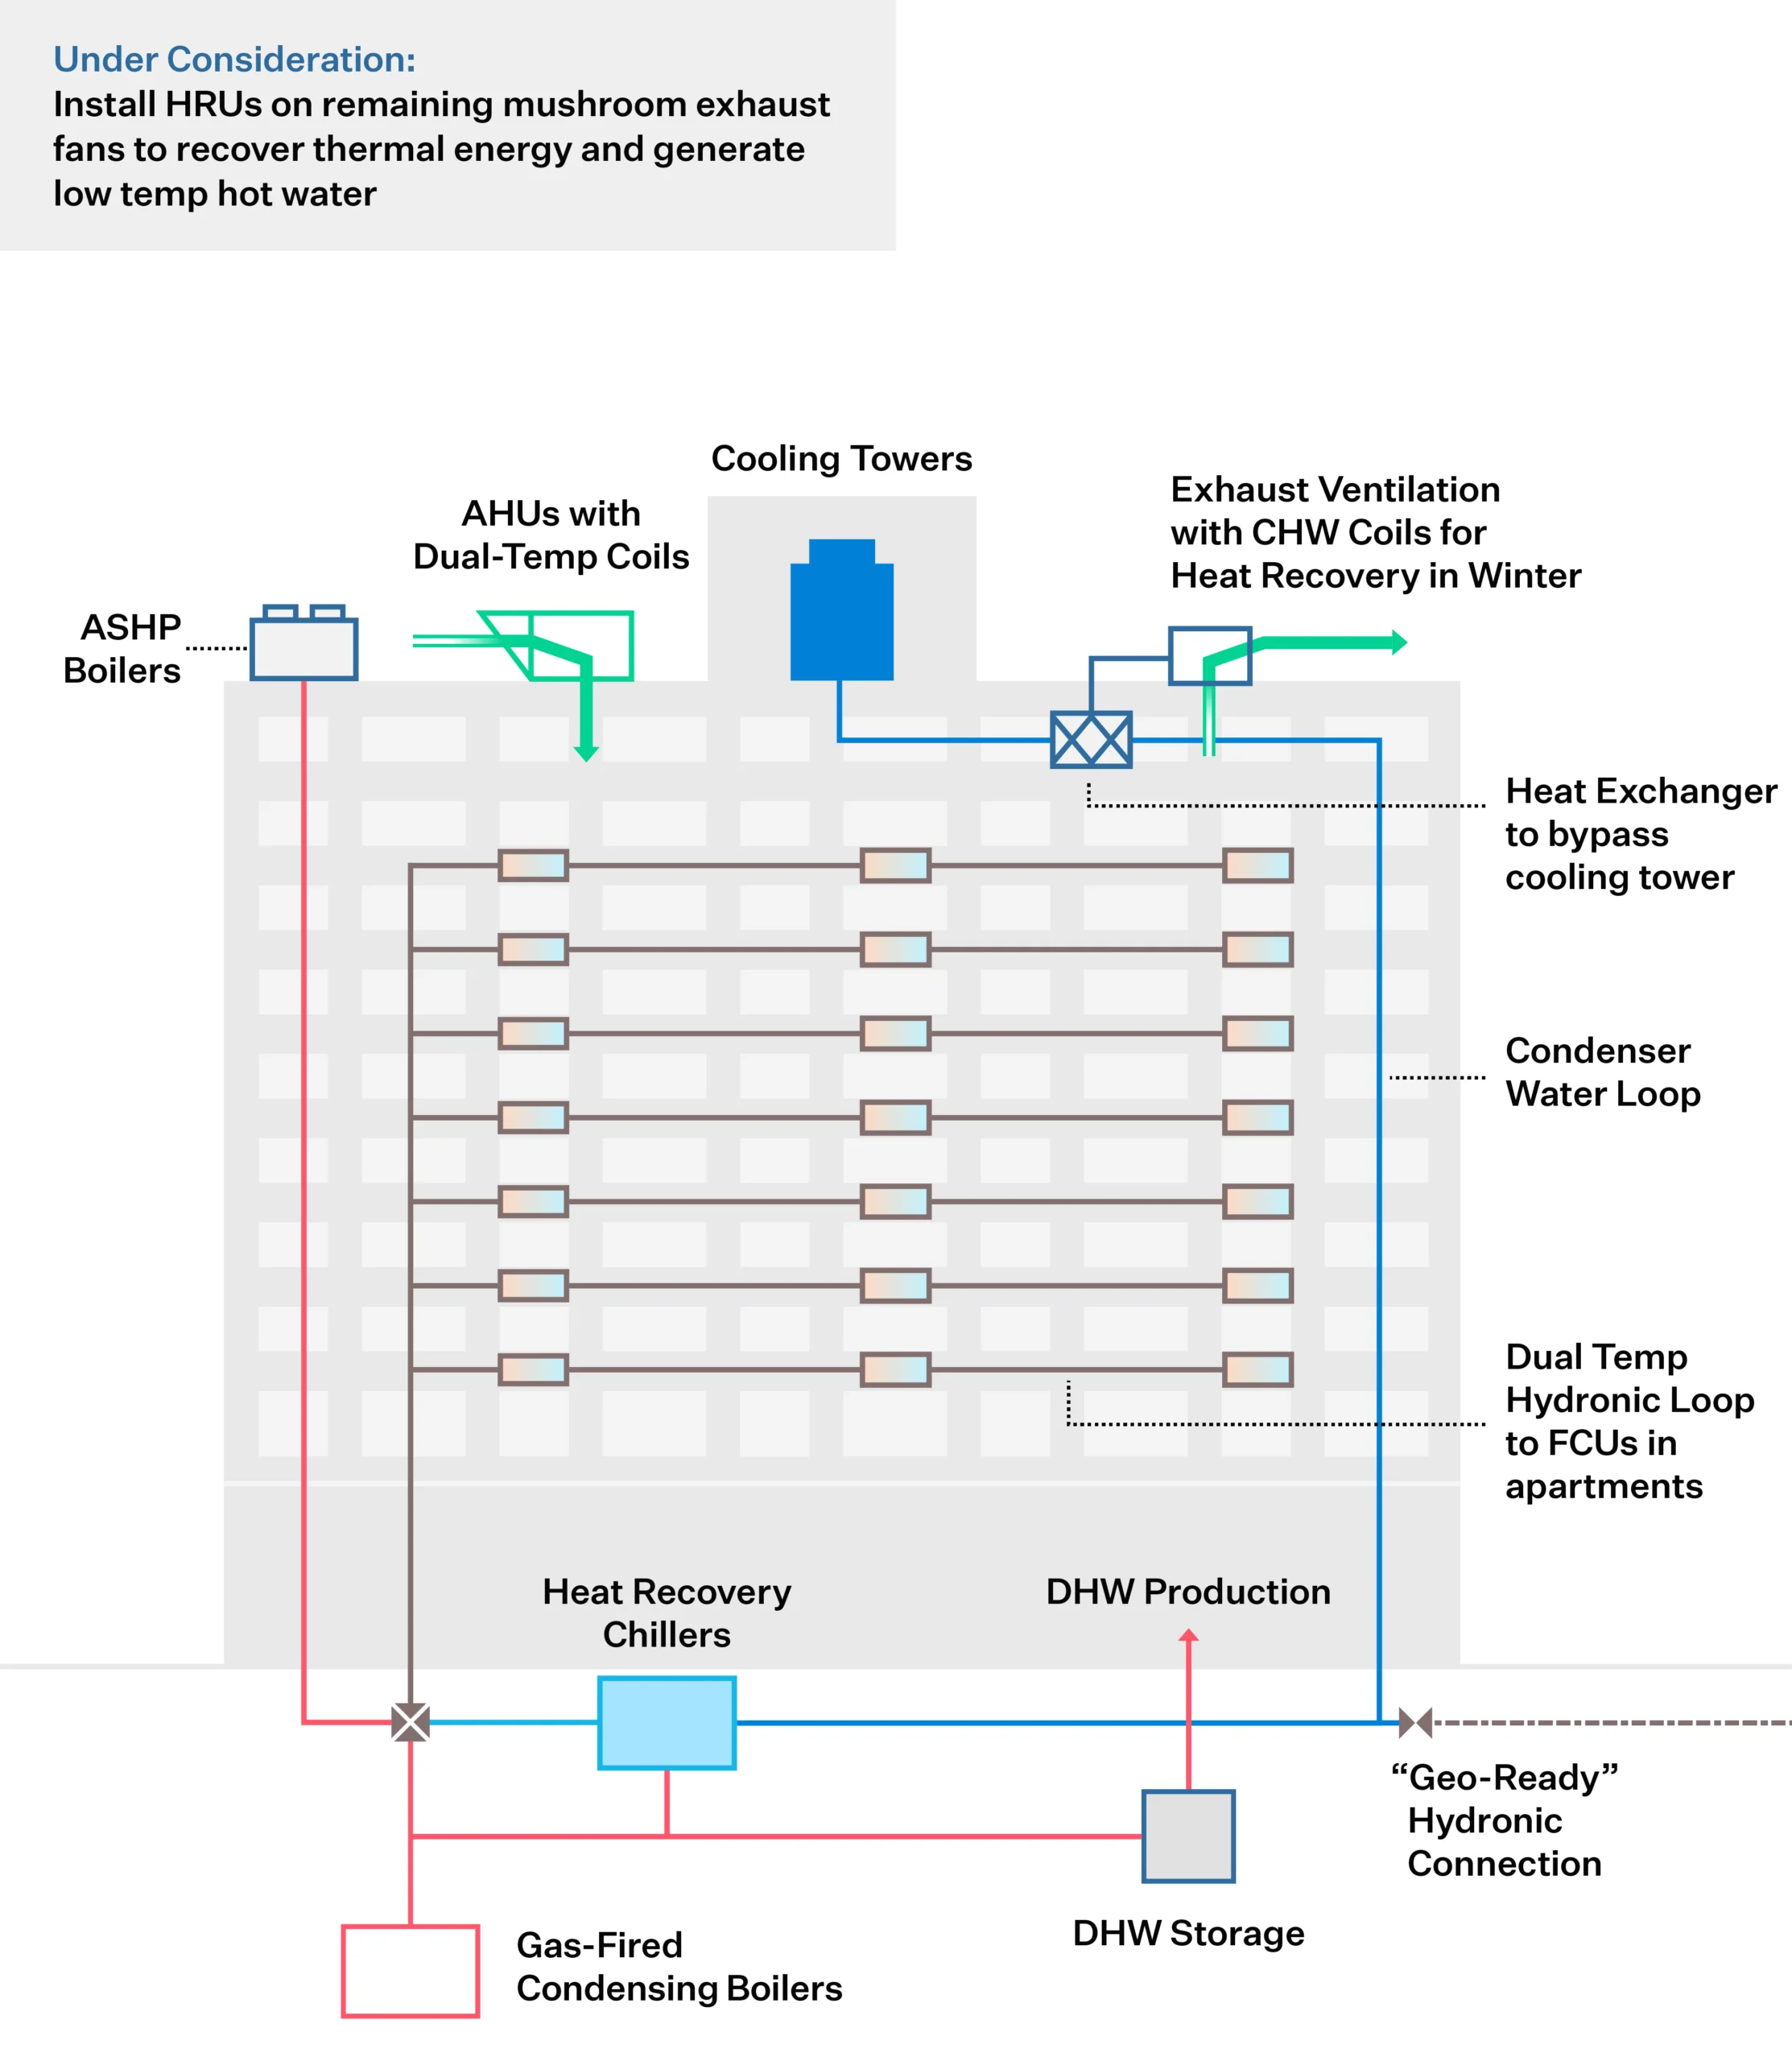
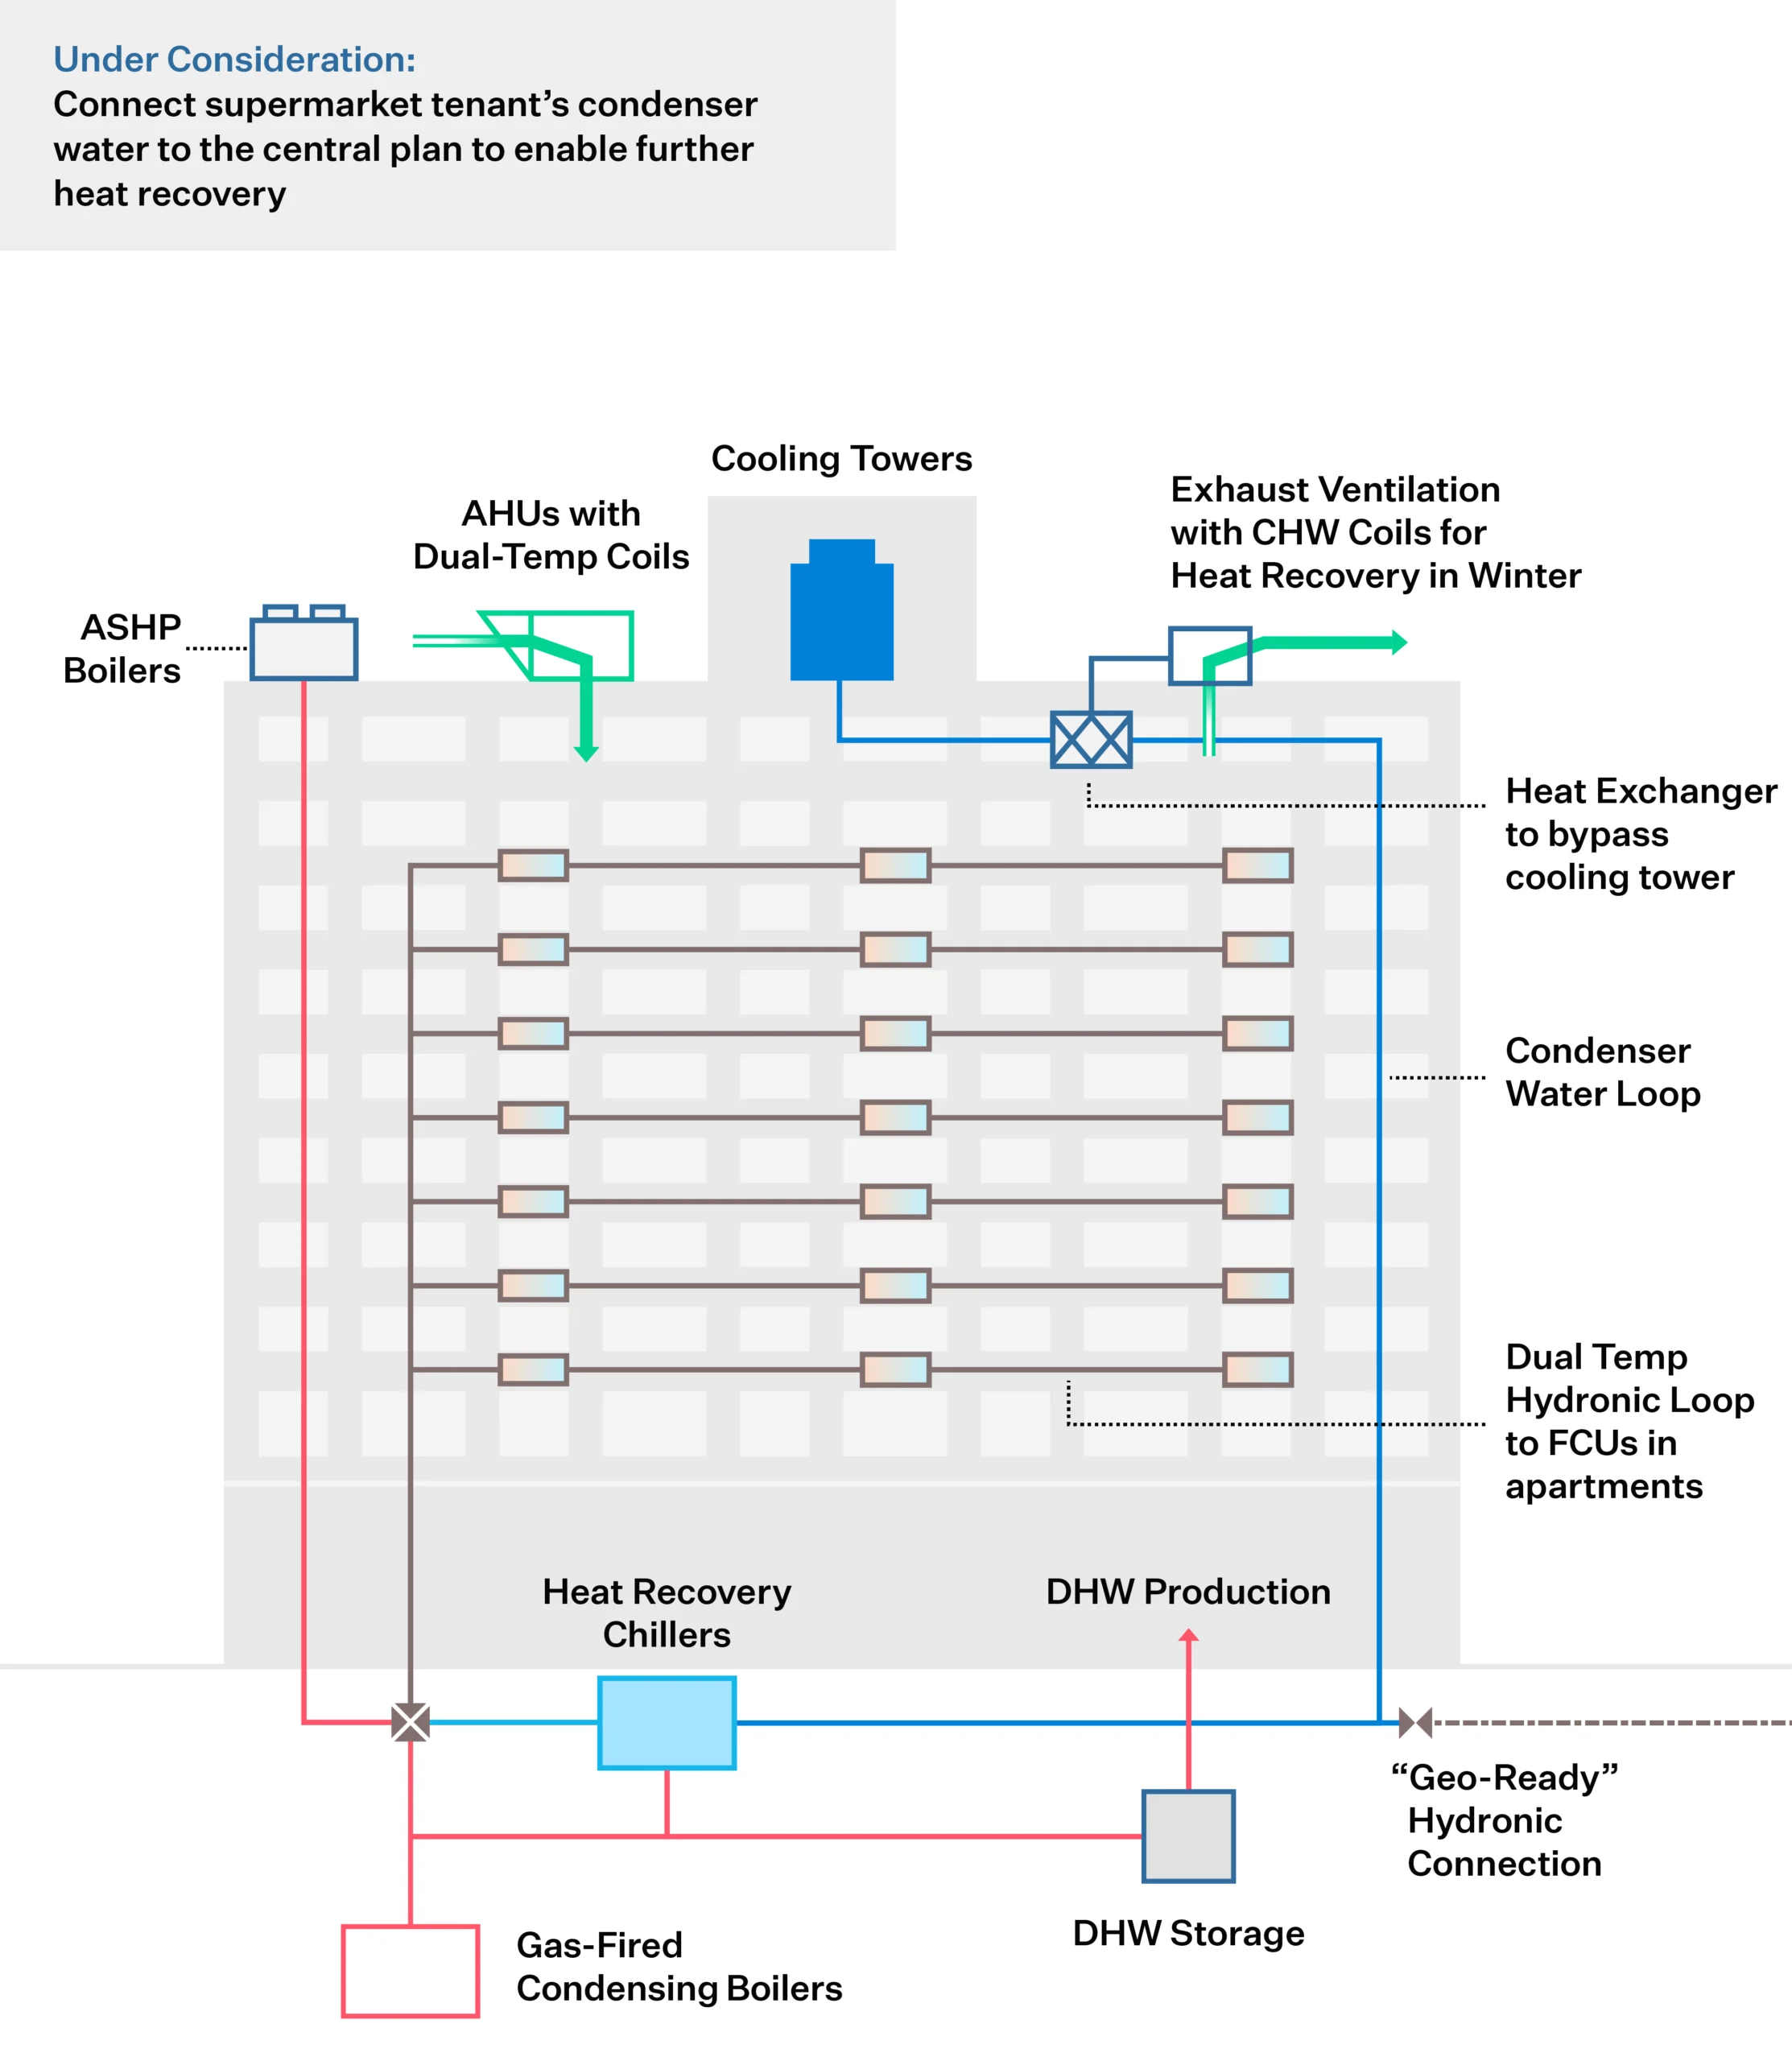
215 East 68th Street is an approximately 1M+ square foot multifamily building in the Upper East Side of Manhattan. Built in 1962 and spanning 32 floors, the building supports tenant heating, cooling, and domestic hot water needs through natural gas boilers and absorption chillers. As a result, the building burns fossil fuels for the entire year, putting the building in Local Law 97 penalty range starting in 2030. Rudin Management plans to retrofit the outdated system with new electric heat recovery chillers to offset natural gas usage and align with New York City’s electrification efforts. The new system eliminates the need for fossil fuel boilers to create cooling and domestic hot water in the summer. The building also intends to install “geo-ready” thermal taps to prepare for a potential future ground loop under the existing parking lot and heat recovery from the 24/7 building exhaust system. The project largely decarbonizes building operations and aligns the building with company-wide sustainability goals.
Project Highlights
Lessons Learned
Heat pump technology is rapidly developing, creating cost-effective opportunities to decarbonize and electrify buildings without sacrificing operating costs.
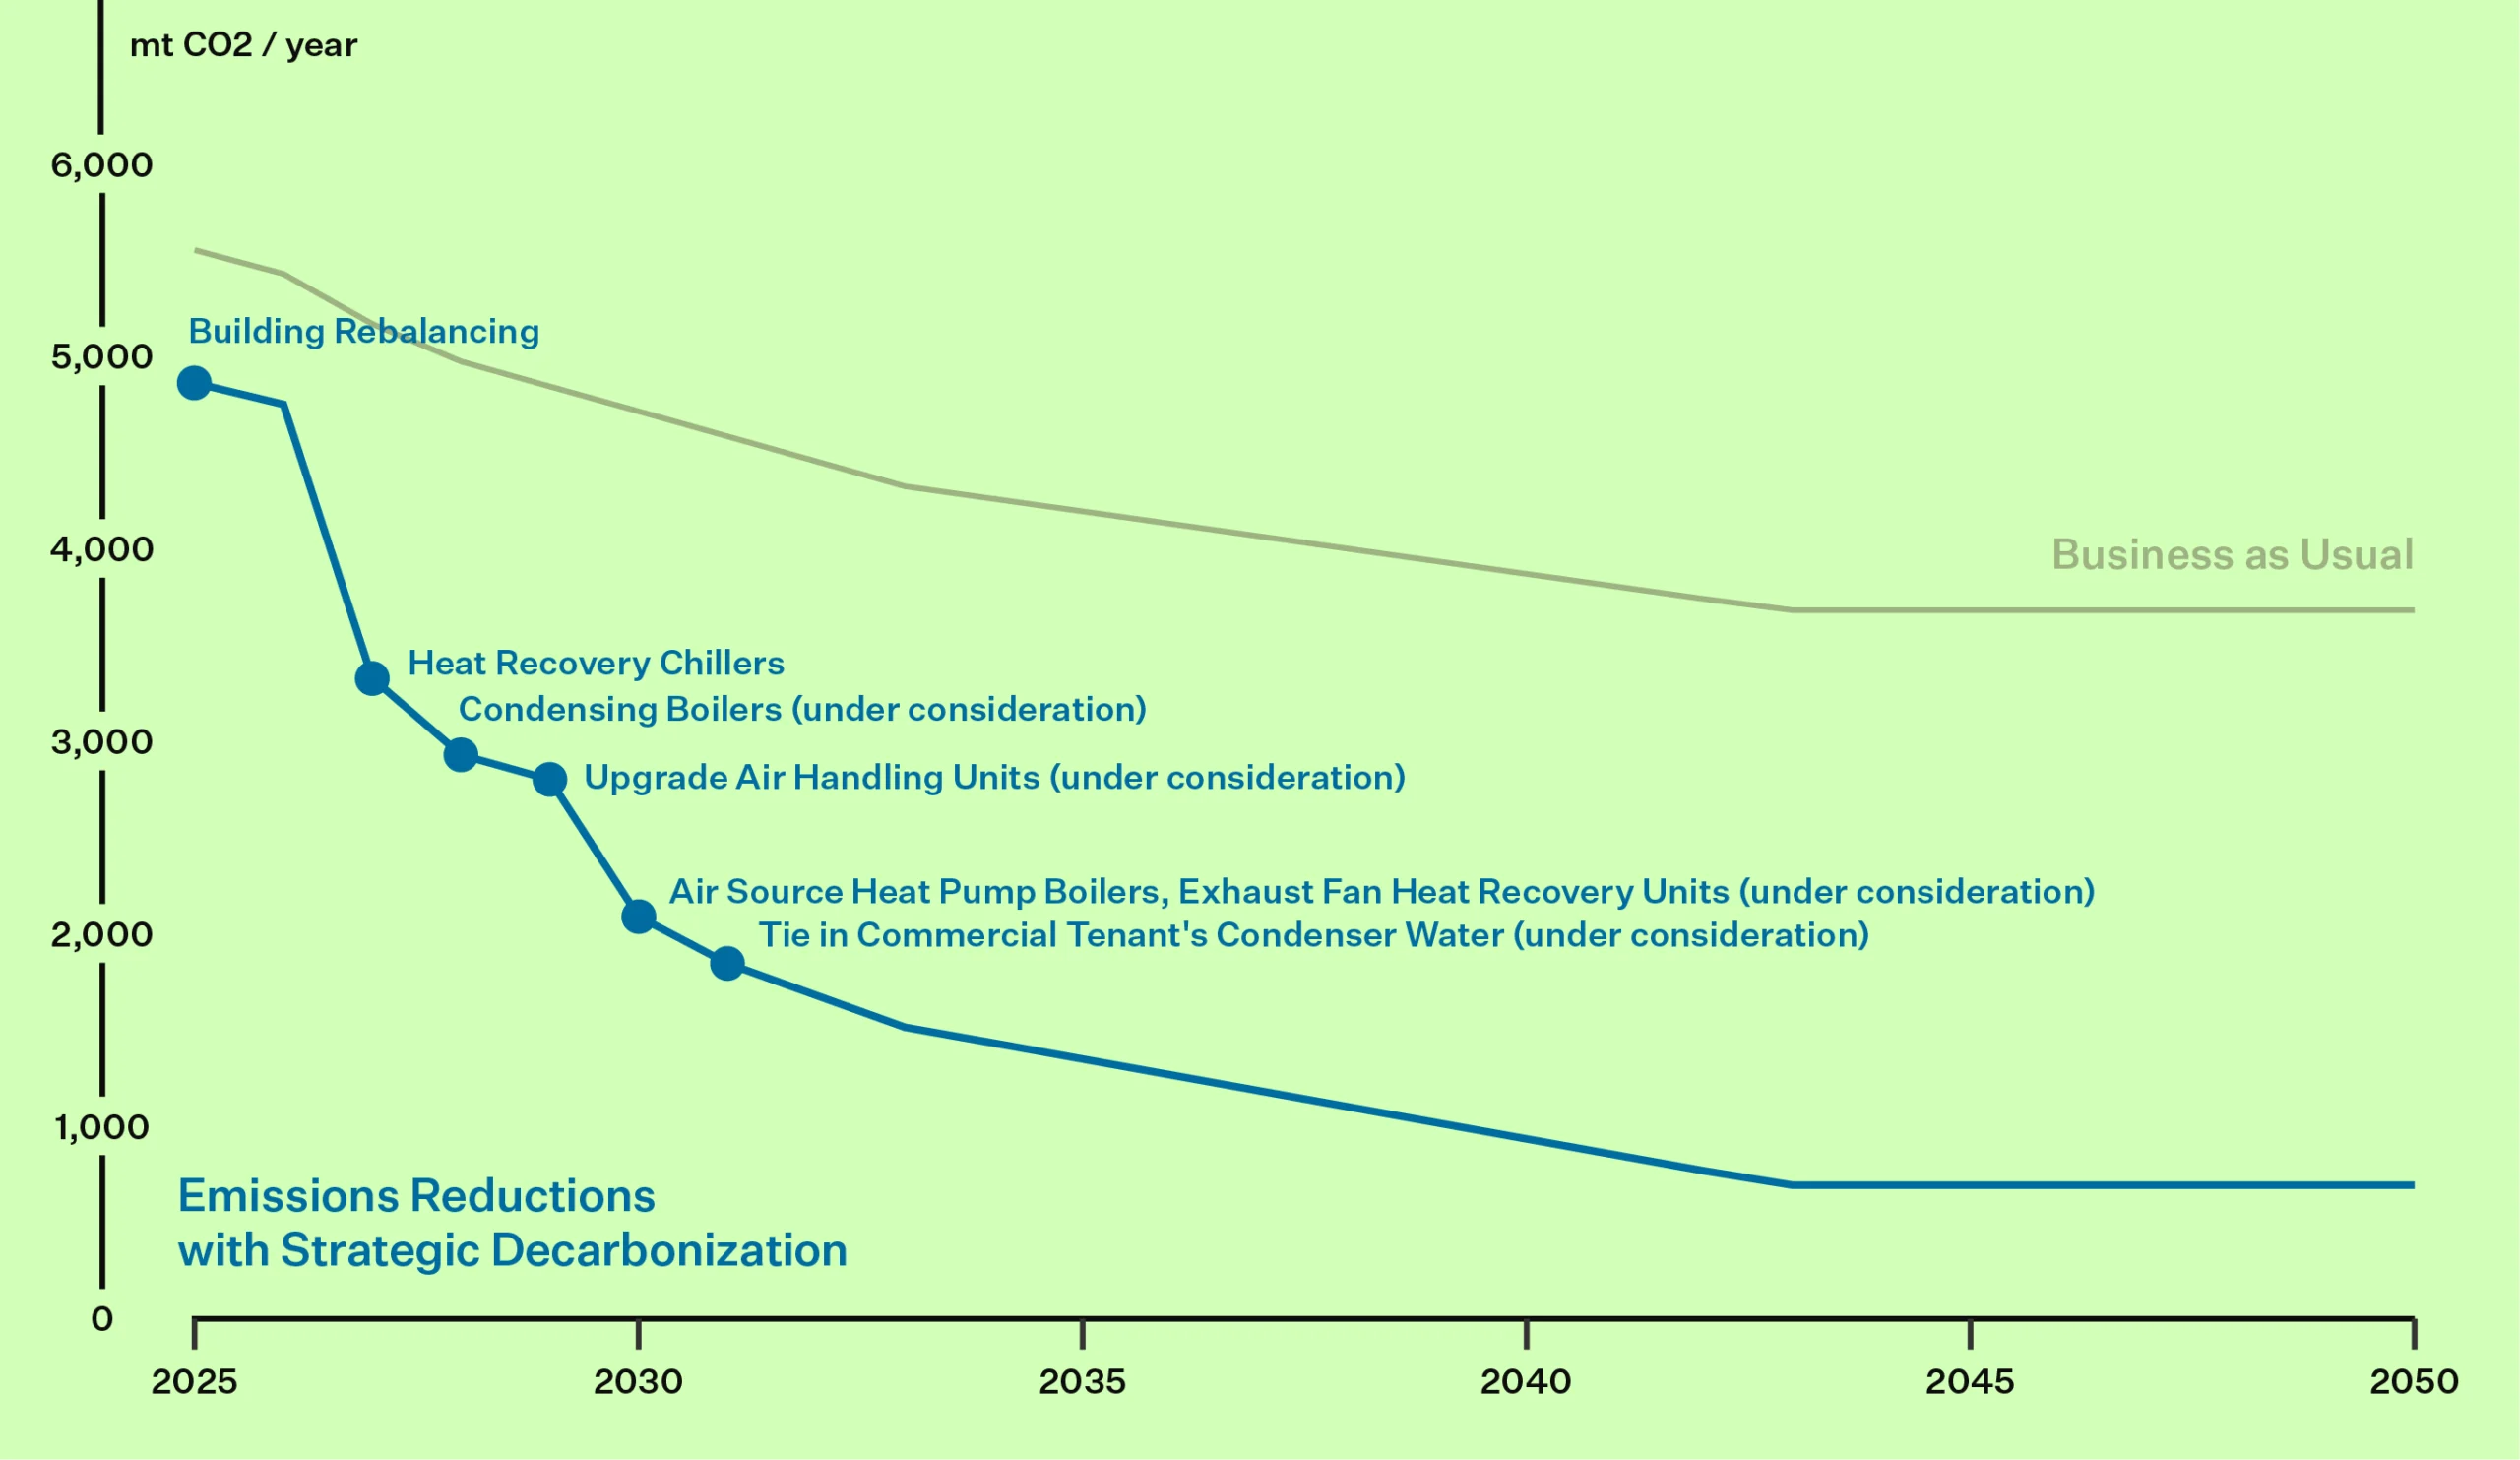
Emissions Reductions
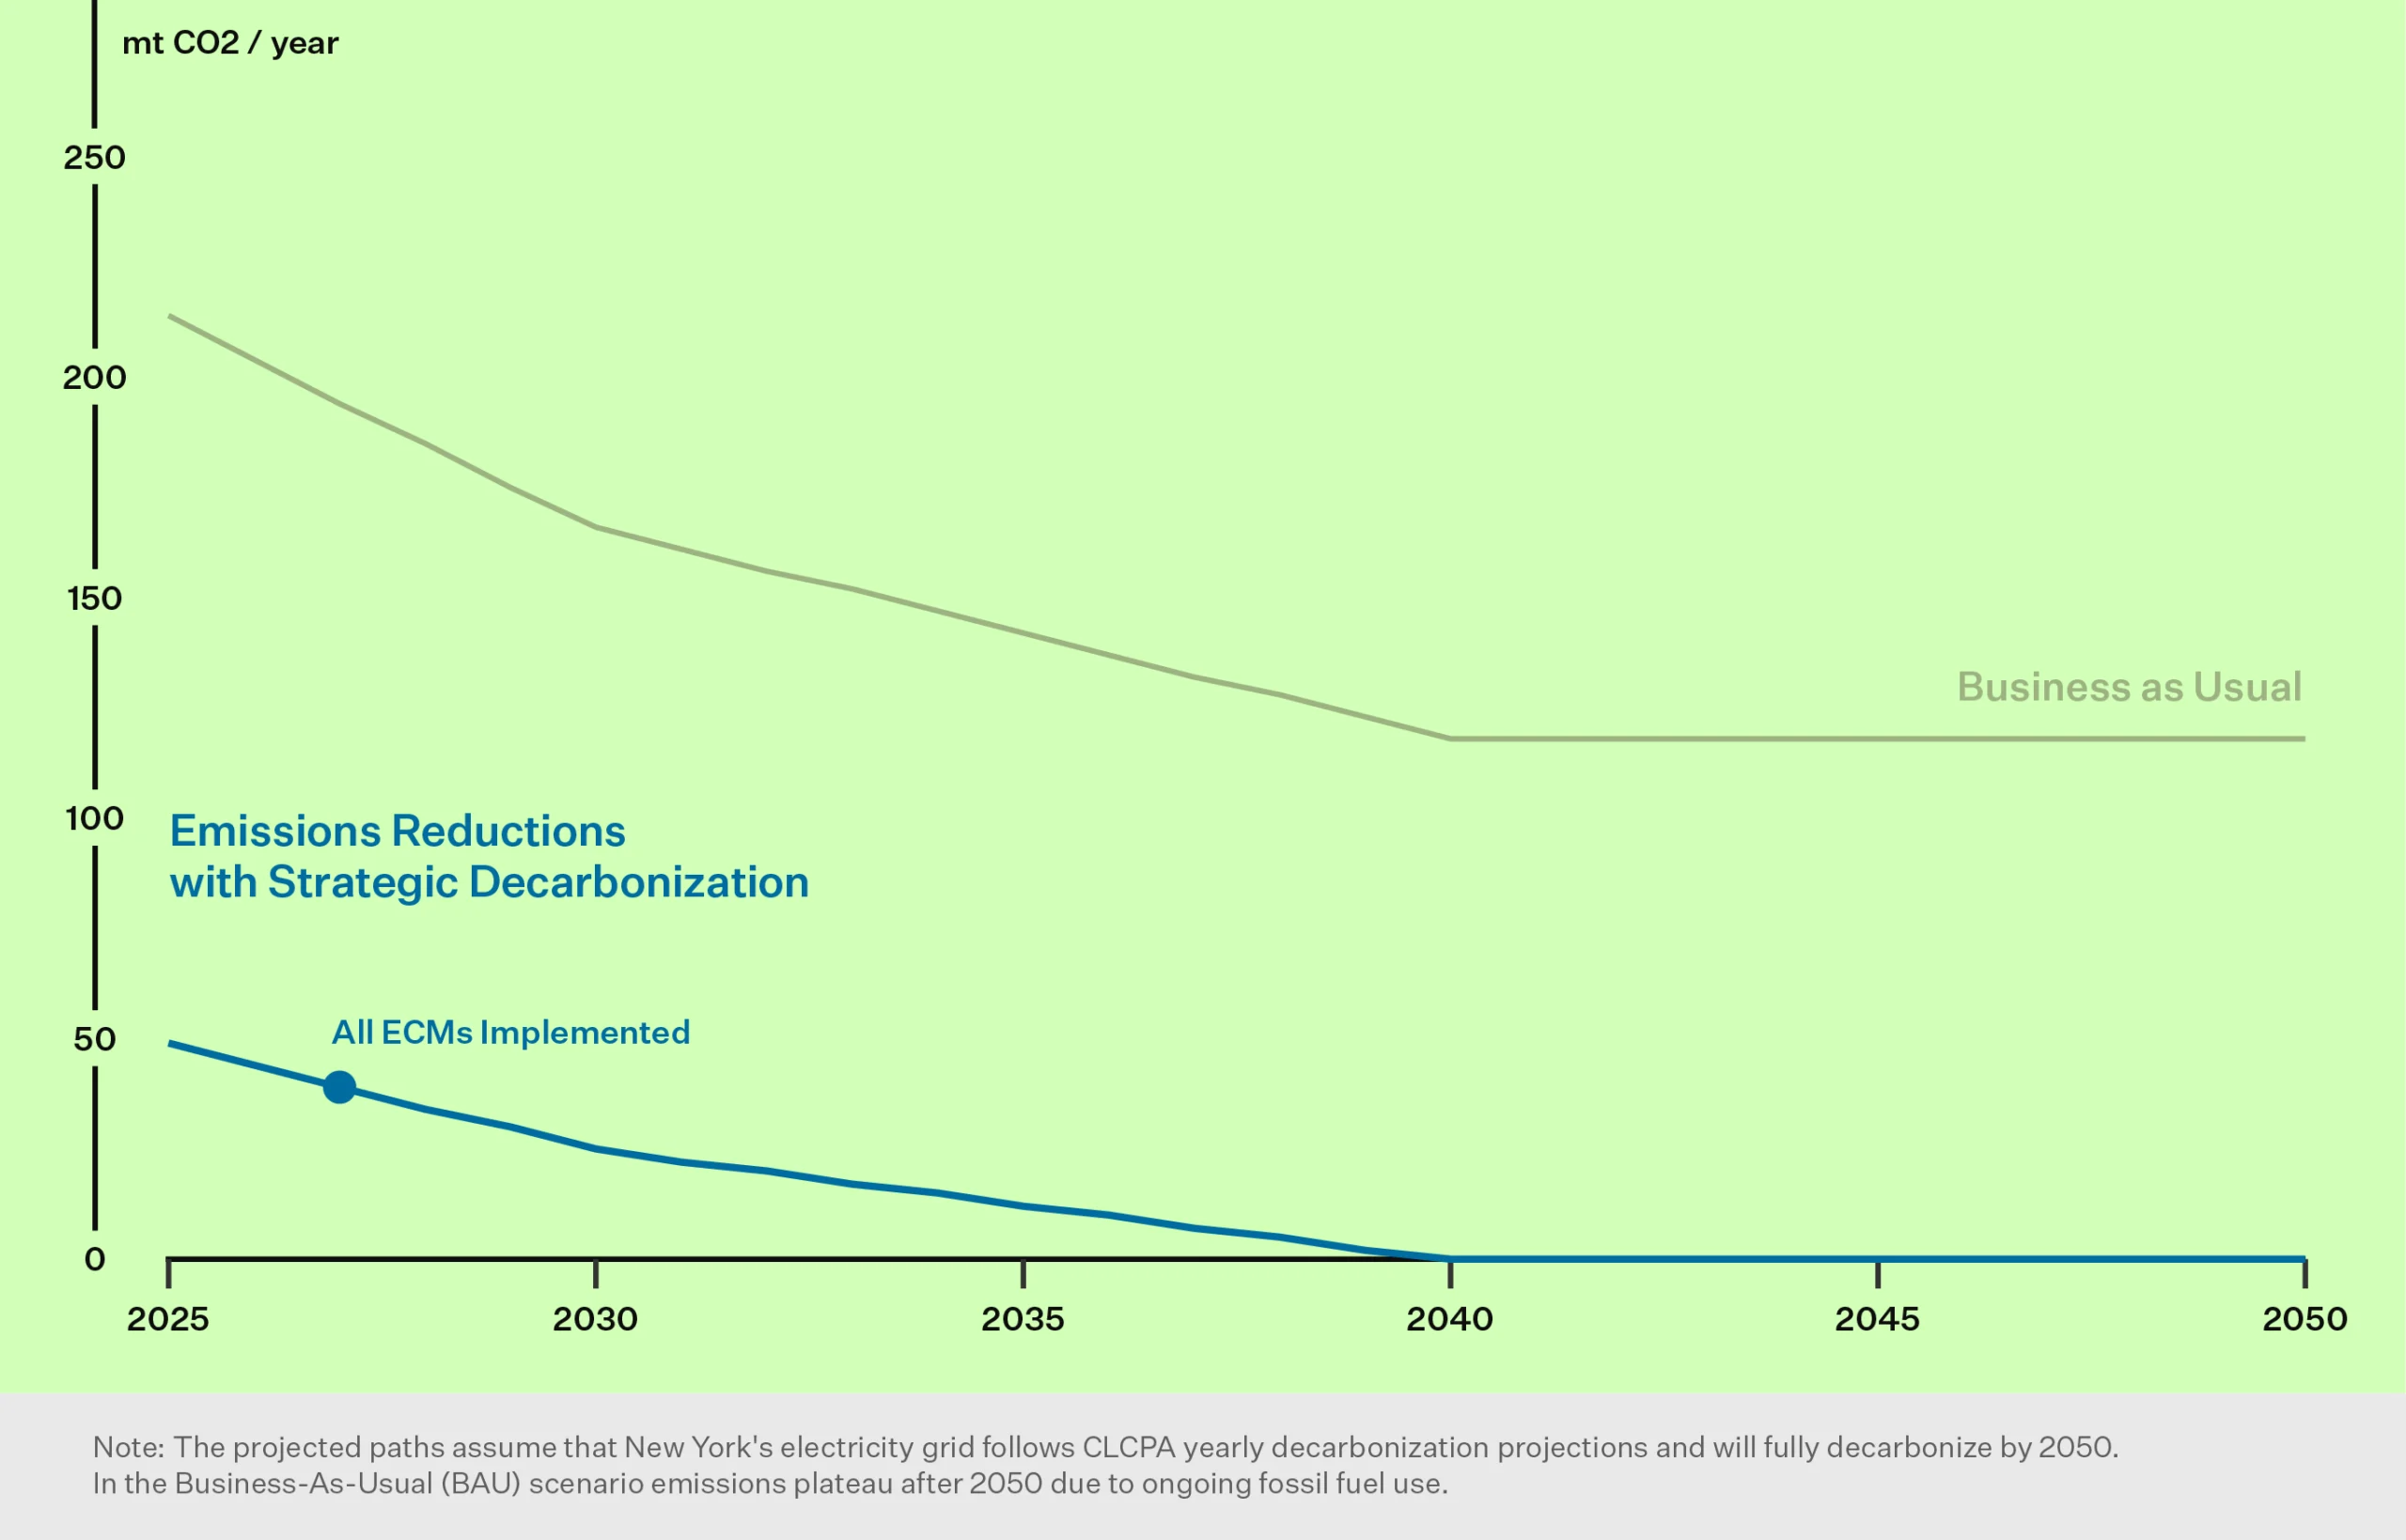
The proposed retrofit avoids penalties associated with Local Law 97 entirely, while also significantly reducing building energy use intensity.
Step 1
Step 1: Examine Current Conditions
A baseline assessment is key to understanding current systems and performance, then identifying conditions, requirements or events that will trigger a decarbonization effort. The assessment looks across technical systems, asset strategy and sectoral factors.
Building System Conditions
Equipment nearing end-of-life
Efficiency improvements
Asset Conditions
Capital event cycles
Carbon emissions limits
Market Conditions
Technology improves
Policy changes
Infrastructure transitions
Fuels phase out
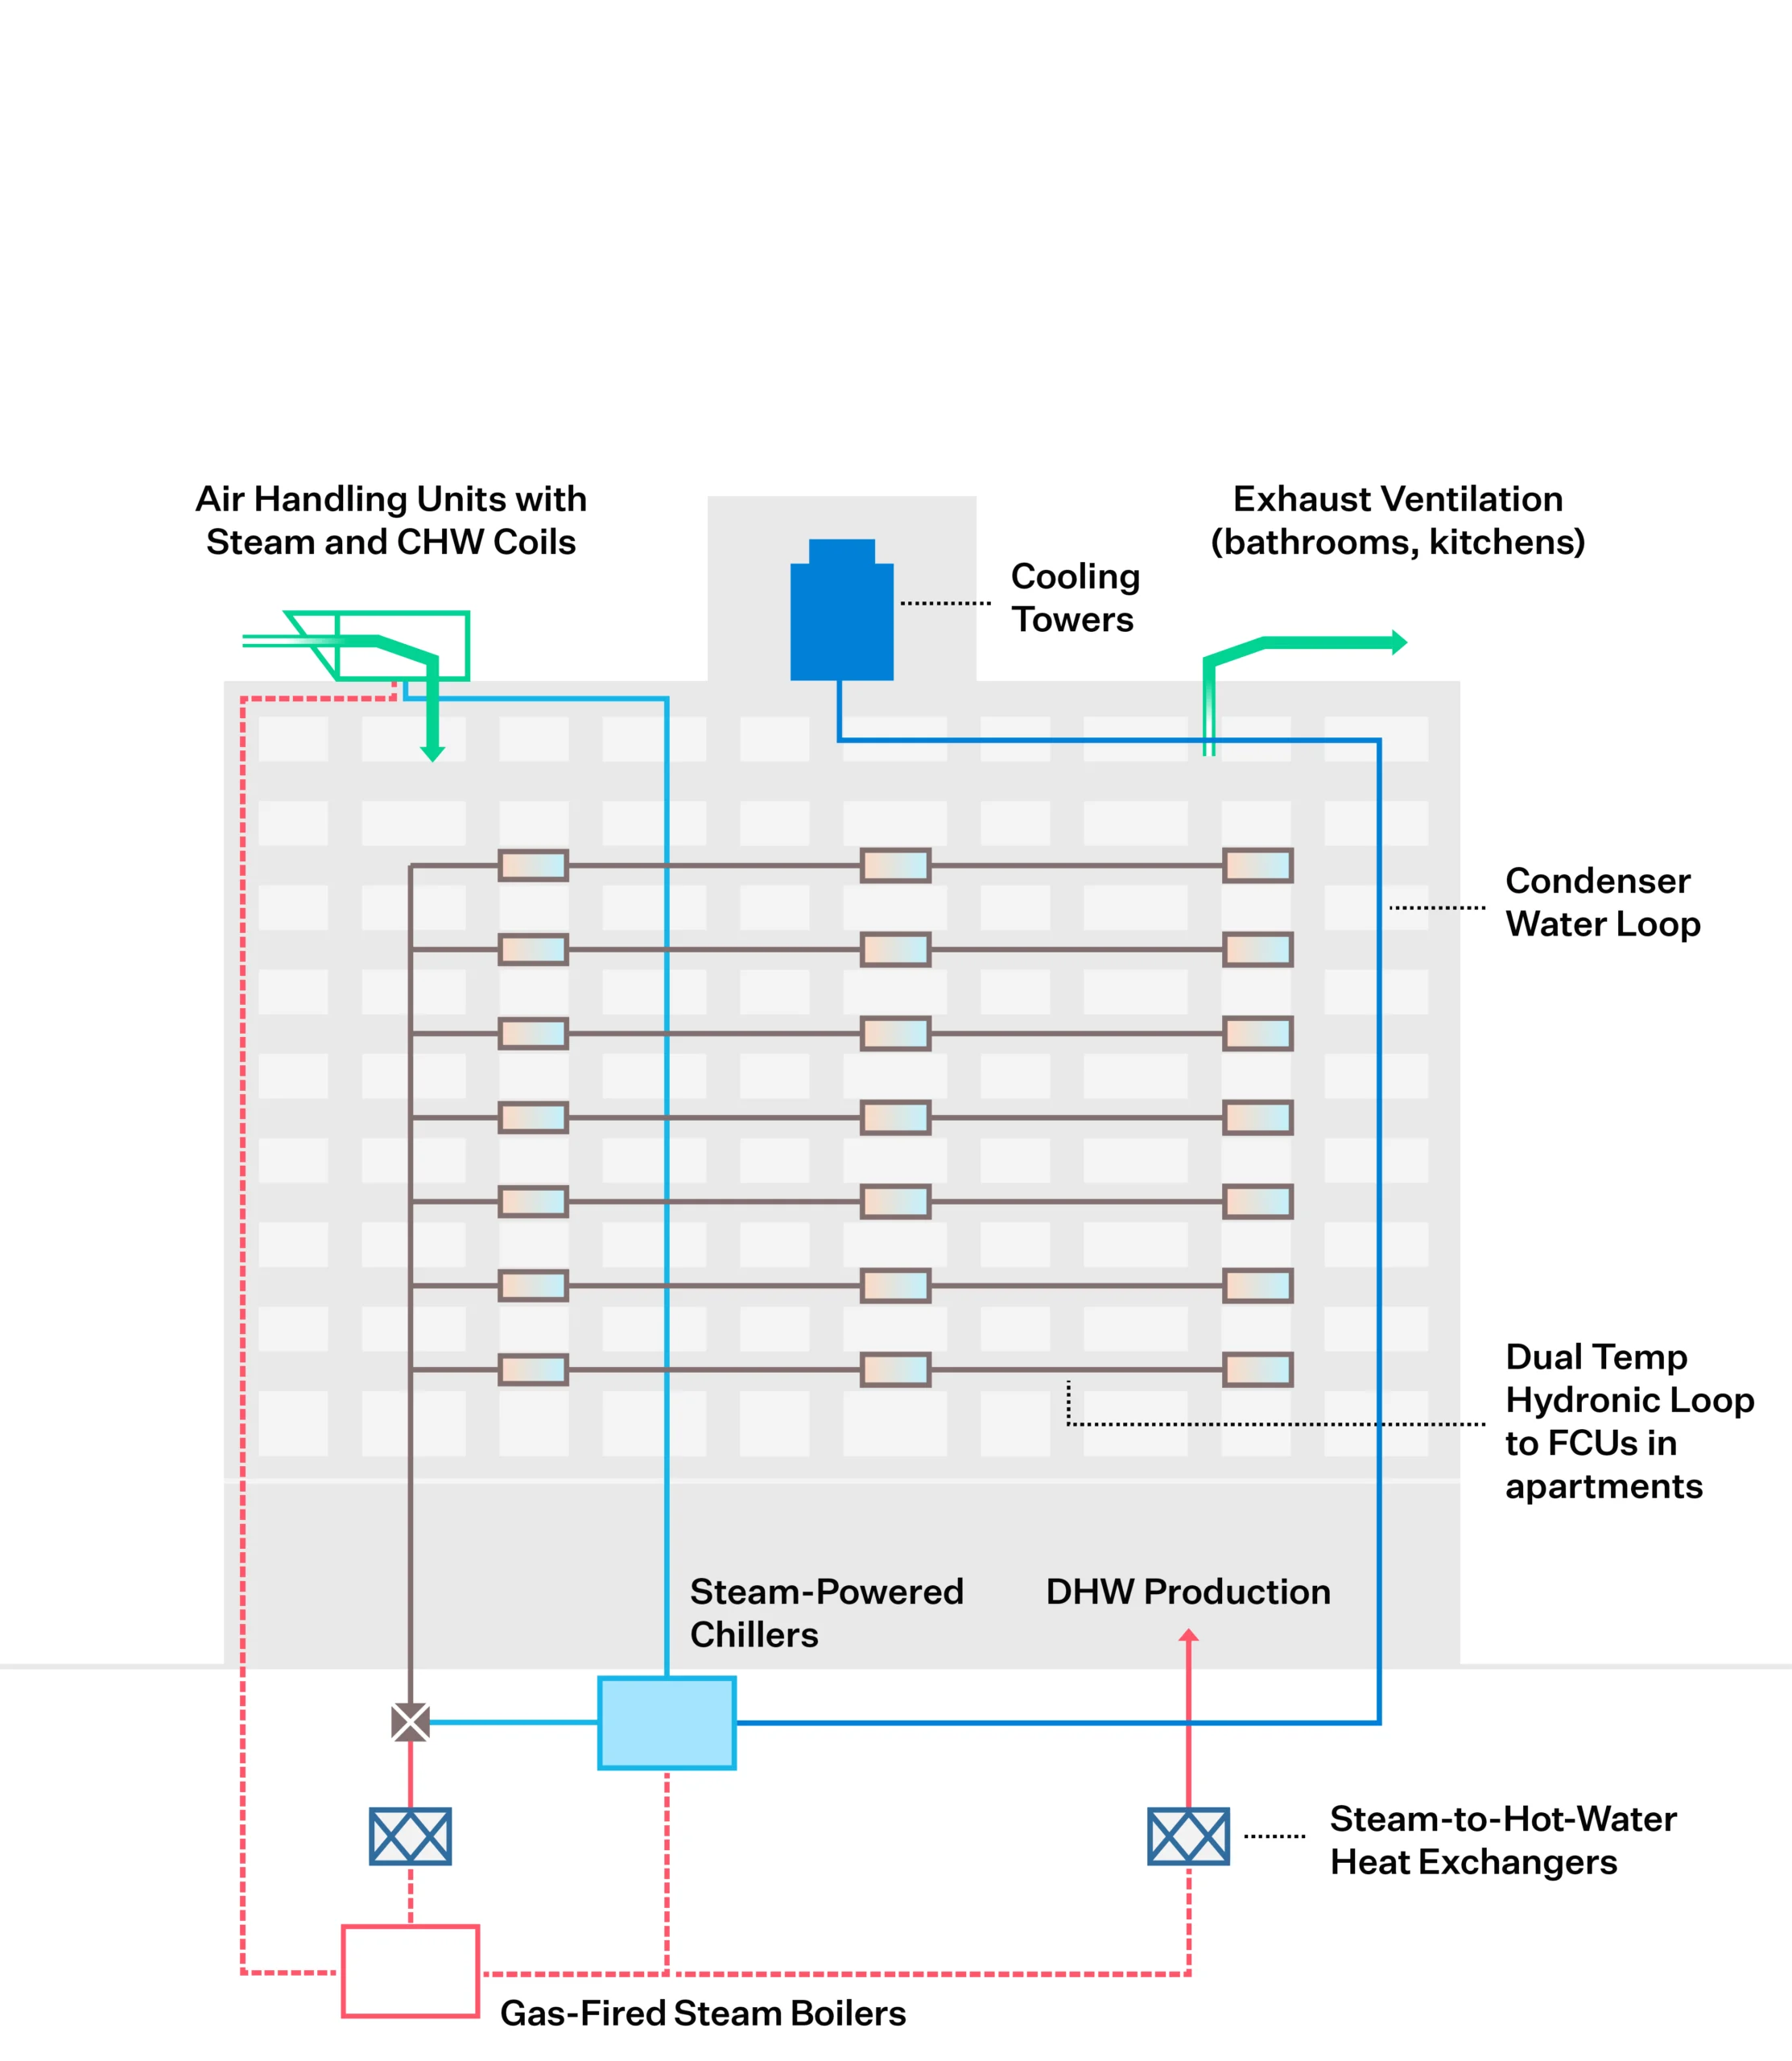
The last major cooling plant upgrade at 215 East 68th Street was in 2001 when three, low pressure steam absorption chillers were installed. Since then, NYC introduced new carbon emission limits as part of LL97. The new laws push for the electrification of buildings to mitigate significant financial penalties associated with burning fossil fuels. In the case of 215 East 68th Street, building ownership is facing annual penalties exceeding $250,000 per year starting in 2030. As a result, Rudin sees an opportunity to replace the fossil-fuel cooling plant with an electric plant that generates domestic hot water and recovers building waste heat. The new system eliminates the 2030 penalty entirely and significantly reduces the building energy use intensity (EUI).
Step 2
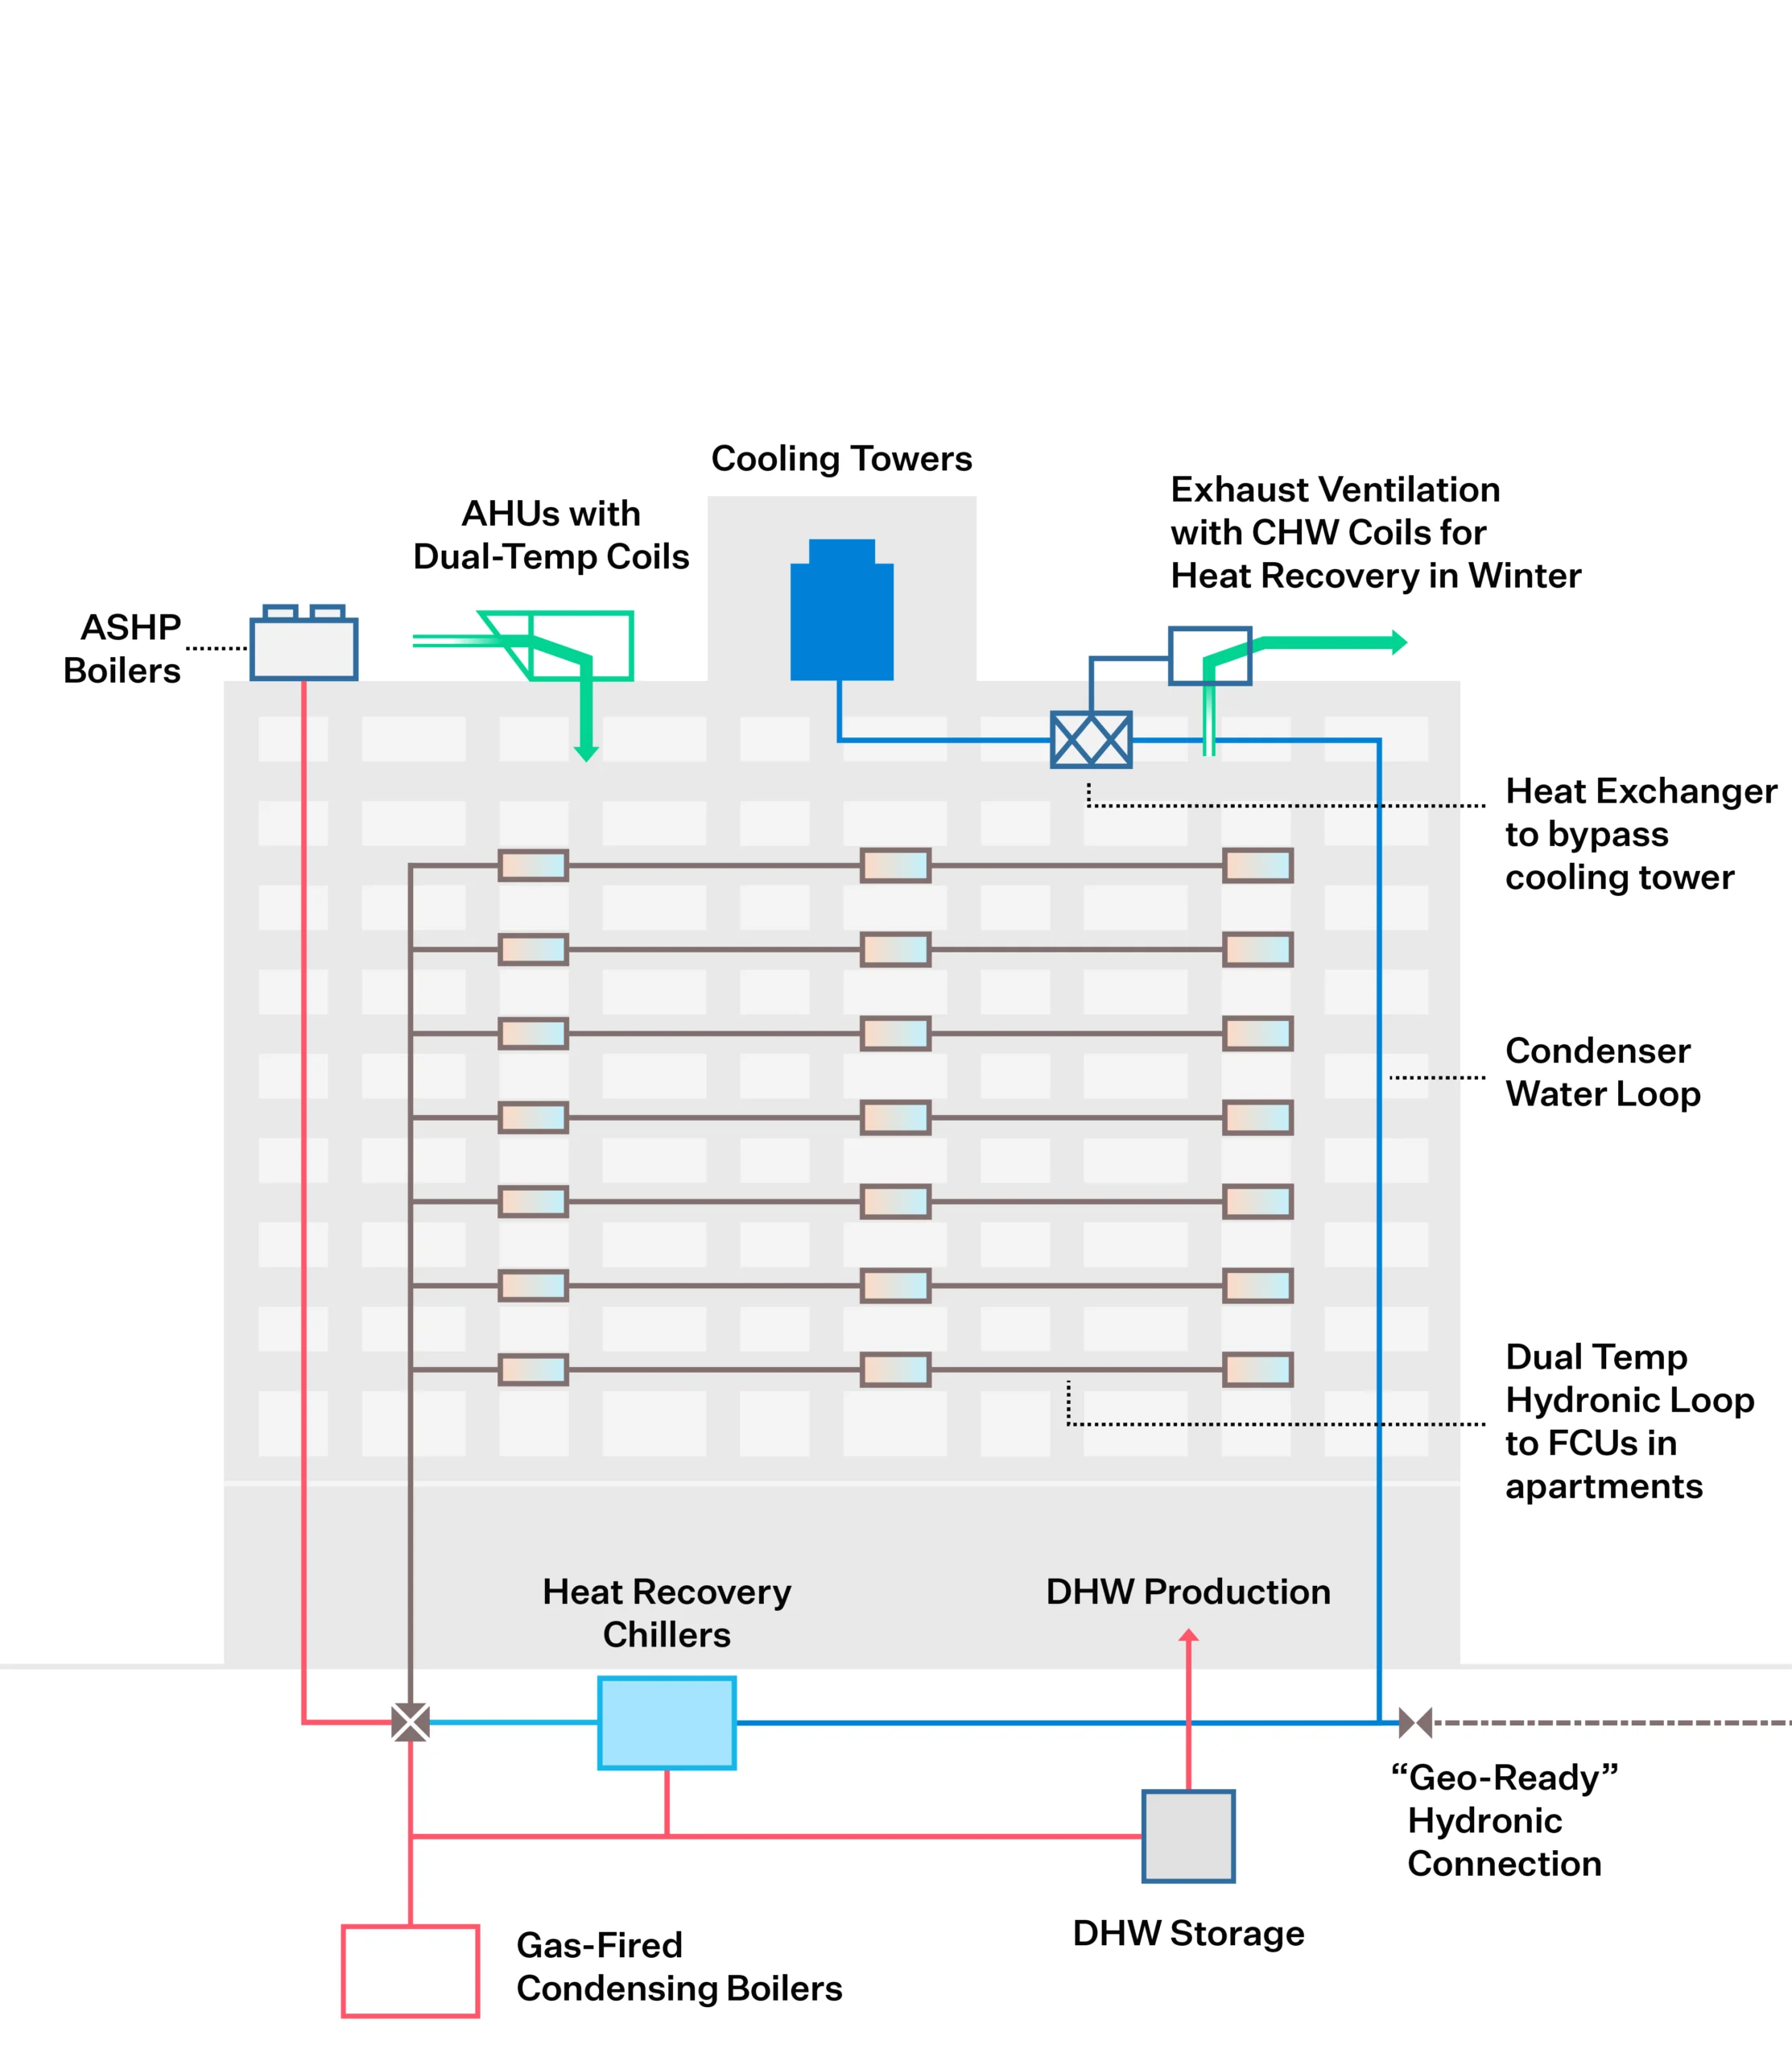
Step 2: Design Resource Efficient Solutions
Effective engineering integrates measures for reducing energy load, recovering wasted heat, and moving towards partial or full electrification. This increases operational efficiencies, optimizes energy peaks, and avoids oversized heating systems, thus alleviating space constraints and minimizing the cost of retrofits to decarbonize the building over time.
Existing Conditions
This diagram illustrates the building prior to the initiation of Strategic Decarbonization planning by the owners and their teams.
Click through the measures under “Building After” to understand the components of the building’s energy transition.
Sequence of Measures
2025
2026
2027
2028
2029
2030
Building System Affected
heating
cooling
ventilation
Step 3
Step 3: Build the Business Case
Making a business case for strategic decarbonization requires thinking beyond a traditional energy audit approach or simple payback analysis. It assesses business-as-usual costs and risks against the costs and added value of phased decarbonization investments in the long-term.
Decarbonization Costs
$16M
Cost of ECM #1: 1.2M.
Cost of ECM #2: 14M.
Business-as-Usual Costs
$4.4M
Energy cost savings: 477k.
Repairs and maintenance savings: -150k.
BAU cost of system replacement/upgrades: 4.1M.
Business-as-Usual Risks
$2.7M
Local Law 97 or other regulatory fines:
2030-2034: 294k.
2035-2039: 483k.
2040-2049: 668k.
2050+: 1.2M.
Decarbonization Value
$3M
Incentives: 3M.
Net Present Value
$3.7M
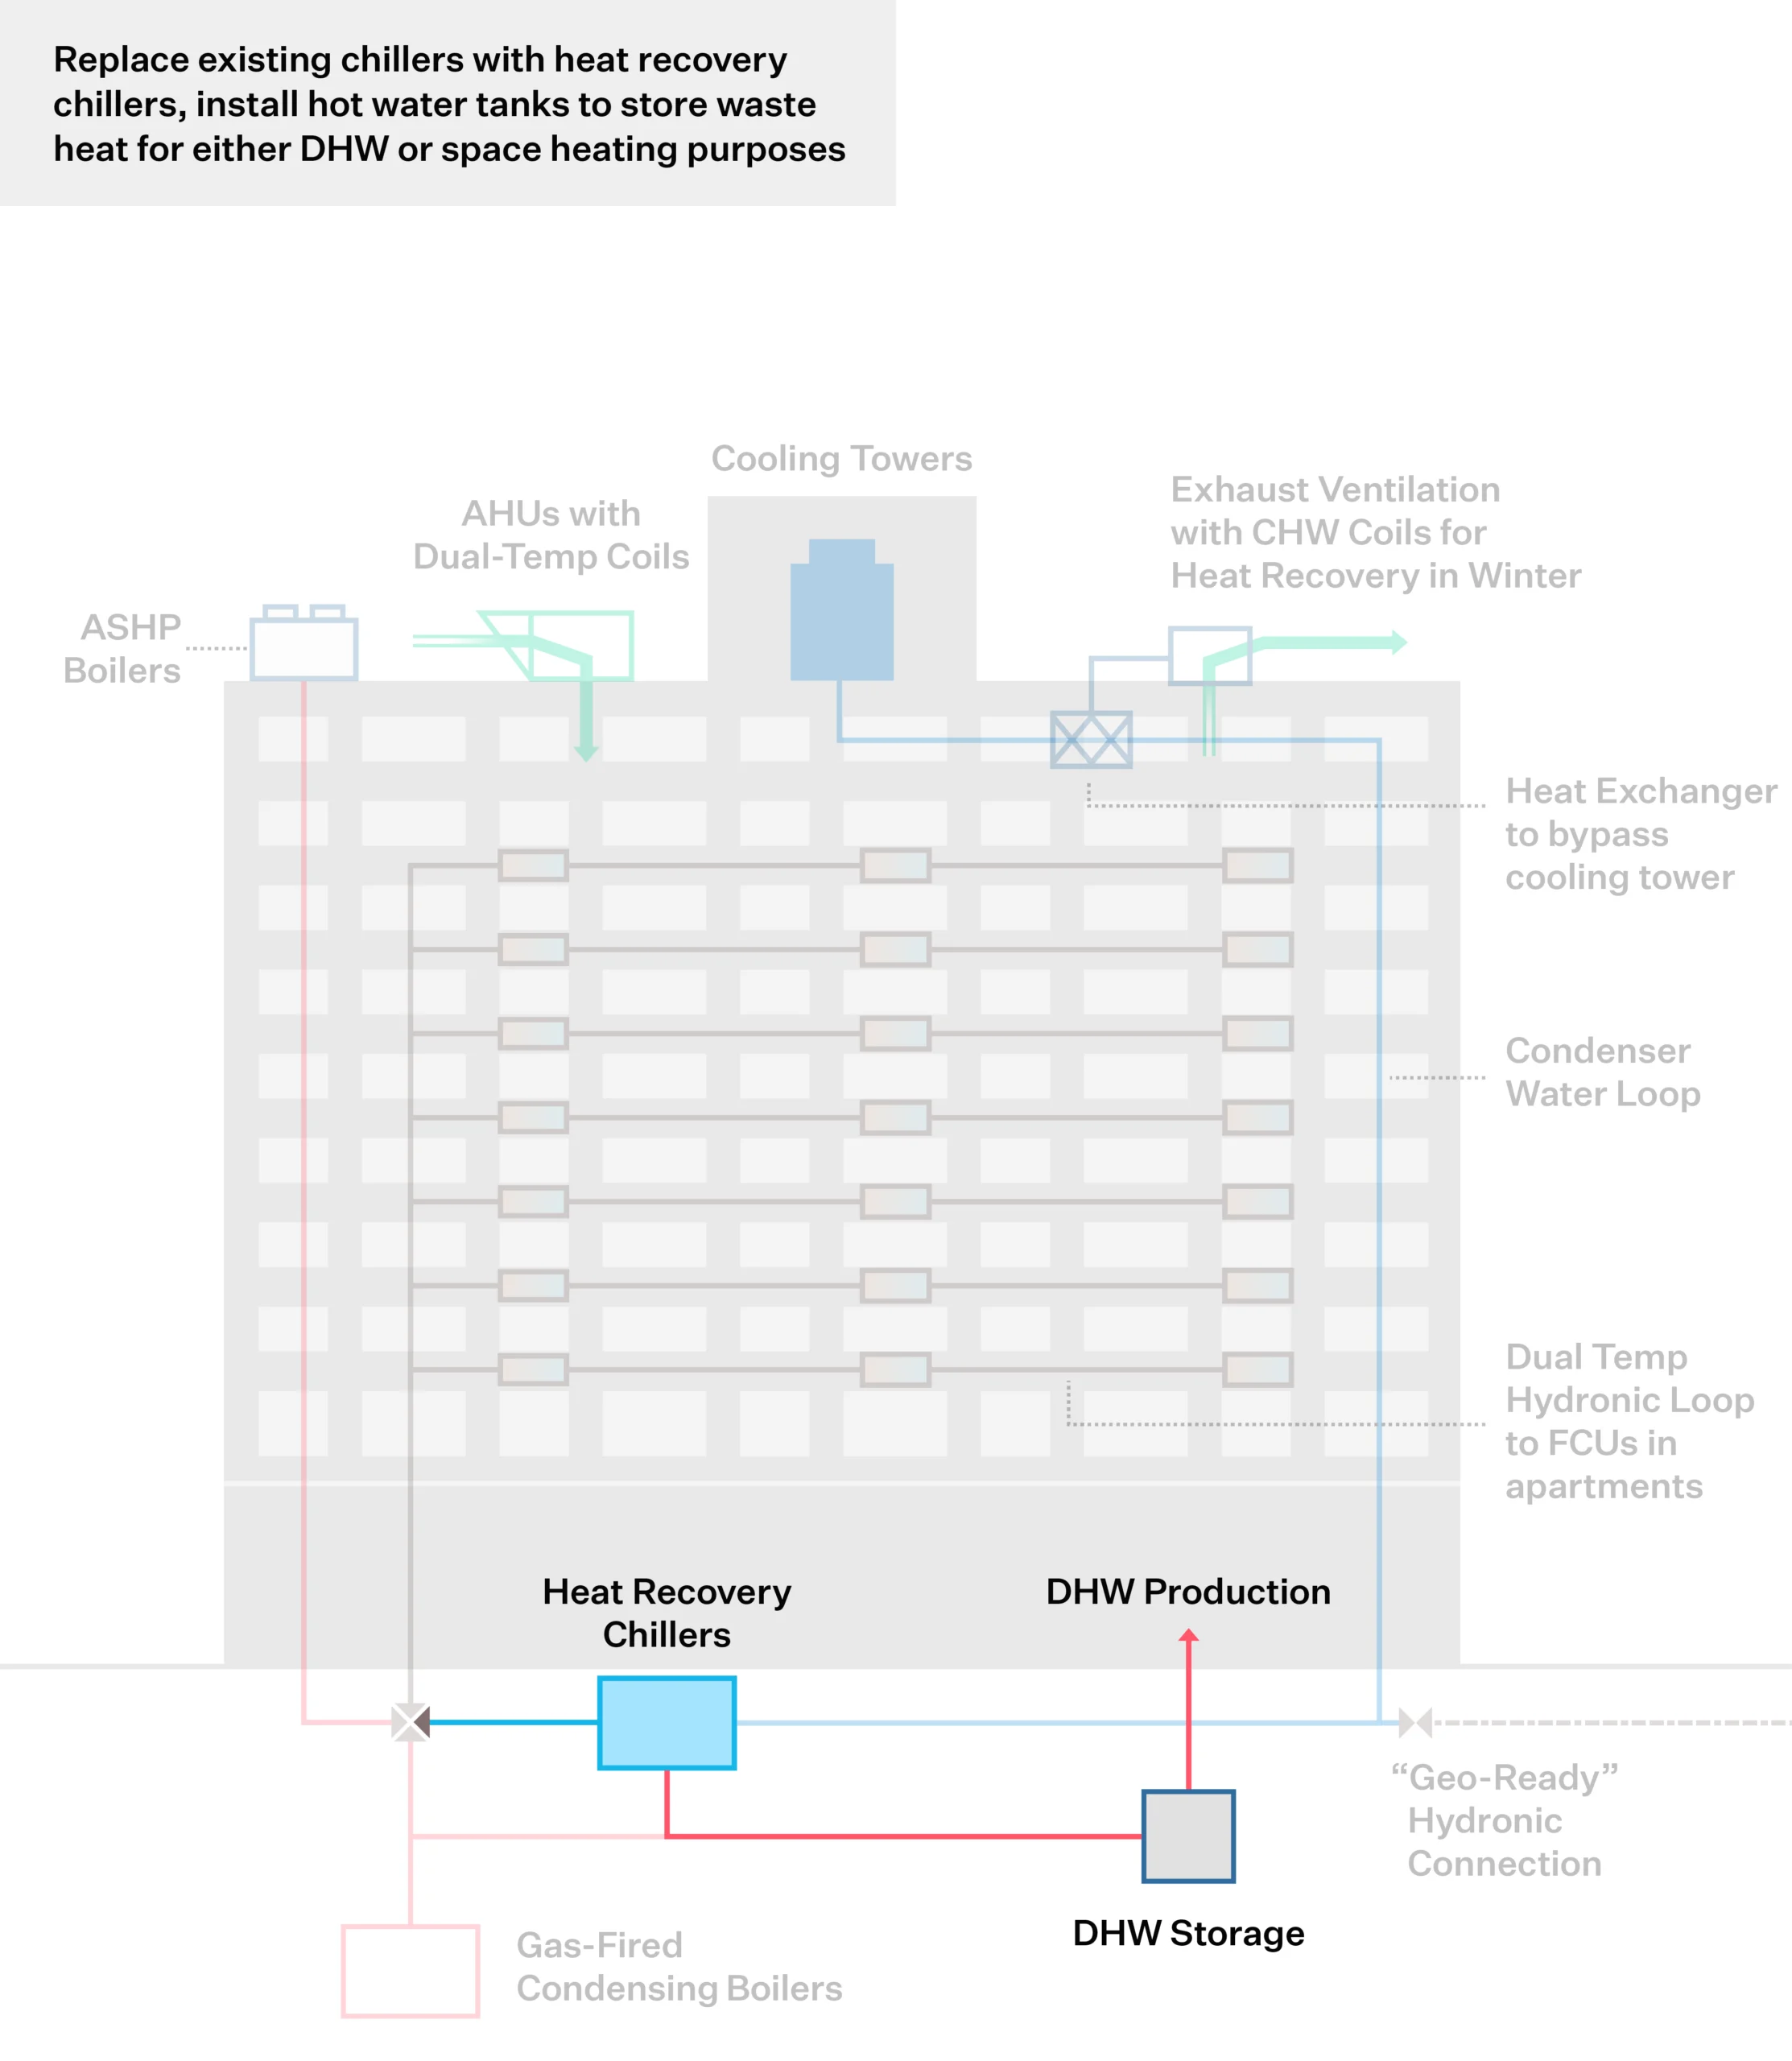
The central cooling plant at 215 East 68th Street is nearing the end of its useful life, prompting Rudin Management to consider the best plan for the buildings plant. The cheapest and simplest approach would be to replace existing low pressure steam absorbers in kind. Weighing the LL97 penalties starting in 2030, the building saw an opportunity to implement a new and electric heat recovery system to eliminate fines and decarbonize the building’s operations. While the electric heat recovery chillers carry a larger upfront cost, the cost of ownership over 30 years is lower than that of a fossil fuel system with a lower upfront cost but significant annual emissions penalties.
Strategic Decarbonization Action Plan
An emissions decarbonization roadmap helps building owners visualize their future emissions reductions by outlining the CO2 reductions from selected energy conservation measures. This roadmap is designed with a phased approach, considering a 20- or 30-year timeline, and incorporates the evolving benefits of grid decarbonization, ensuring a comprehensive view of long-term environmental impact.
Noll Apartments, located at 43 Central Avenue, and Melrose Apartments, located at 63 Central Avenue, are neighboring buildings in Brooklyn, New York. The buildings are 6 stories and total 131,865 square feet with 98 affordable apartment units. The decarbonization retrofit planned for these buildings includes a package of measures that will:
Combine all mechanical equipment into a single central plant serving both buildings which will facilitate thermal energy recovery, allow for the integration of future decarbonized thermal energy sources, and reduce first- and ongoing maintenance costs.
Electrify, and recover energy for, loads currently served by fossil fuels (heating and domestic hot water).
Improve the energy efficiency of the buildings by reducing thermal loads through ventilation energy recovery and envelope improvements
Reduce construction costs by avoiding the staggering of measure implementation where possible.
Creating resilient and sustainable communities are key components of RiseBoro’s mission. The principles of energy efficiency, improved health outcomes, reduced consumption, and responsible use of natural resources are core beliefs of the organization.
Project Highlights
Lessons Learned
The project used the Resource Efficient Decarbonization (RED) methodology to consider various technical and financial options and determine the optimal decarbonization pathway.
Lessons Learned
The project utilizes existing technology in a creative new application to greatly reduce the initial costs of electrification.
Emissions Reductions
61%
A displacement strategy approach was developed to maximize cost-efficacy of decarbonization without burdening affordable housing residents and operators, resulting in a 61% projected energy use reduction for the building by the end of the Empire Building Challenge project.
Step 1
Step 1: Examine Current Conditions
A baseline assessment is key to understanding current systems and performance, then identifying conditions, requirements or events that will trigger a decarbonization effort. The assessment looks across technical systems, asset strategy and sectoral factors.
Building System Conditions
Equipment nearing end-of-life
New heat source potential
Comfort improvements
Indoor air quality improvements
Facade maintenance
Efficiency improvements
Asset Conditions
Capital event cycles
Owner sustainability goals
Market Conditions
Technology improves
Market supply changes
Noll Apartments and Melrose Apartment contain the original HVAC equipment from their construction in the early- and mid-2000s that is nearing the end of its useful life. This aging equipment, considered alongside a recent recapitalization event, presents an opportunity to focus on improving energy efficiency and reducing carbon emissions. Additionally, these buildings are part of a tranche of buildings in the RiseBoro portfolio constructed prior to the adoption of more aggressive energy efficiency approaches. Implementation of the decarbonization retrofits will not only lower the buildings’ emissions, but will also bring energy performance up to, or higher than, other buildings in the portfolio. The Empire Building Challenge program provided a unique opportunity at a convenient time to create a holistic roadmap and retrofit plan.
Step 2
Step 2: Design Resource Efficient Solutions
Effective engineering integrates measures for reducing energy load, recovering wasted heat, and moving towards partial or full electrification. This increases operational efficiencies, optimizes energy peaks, and avoids oversized heating systems, thus alleviating space constraints and minimizing the cost of retrofits to decarbonize the building over time.
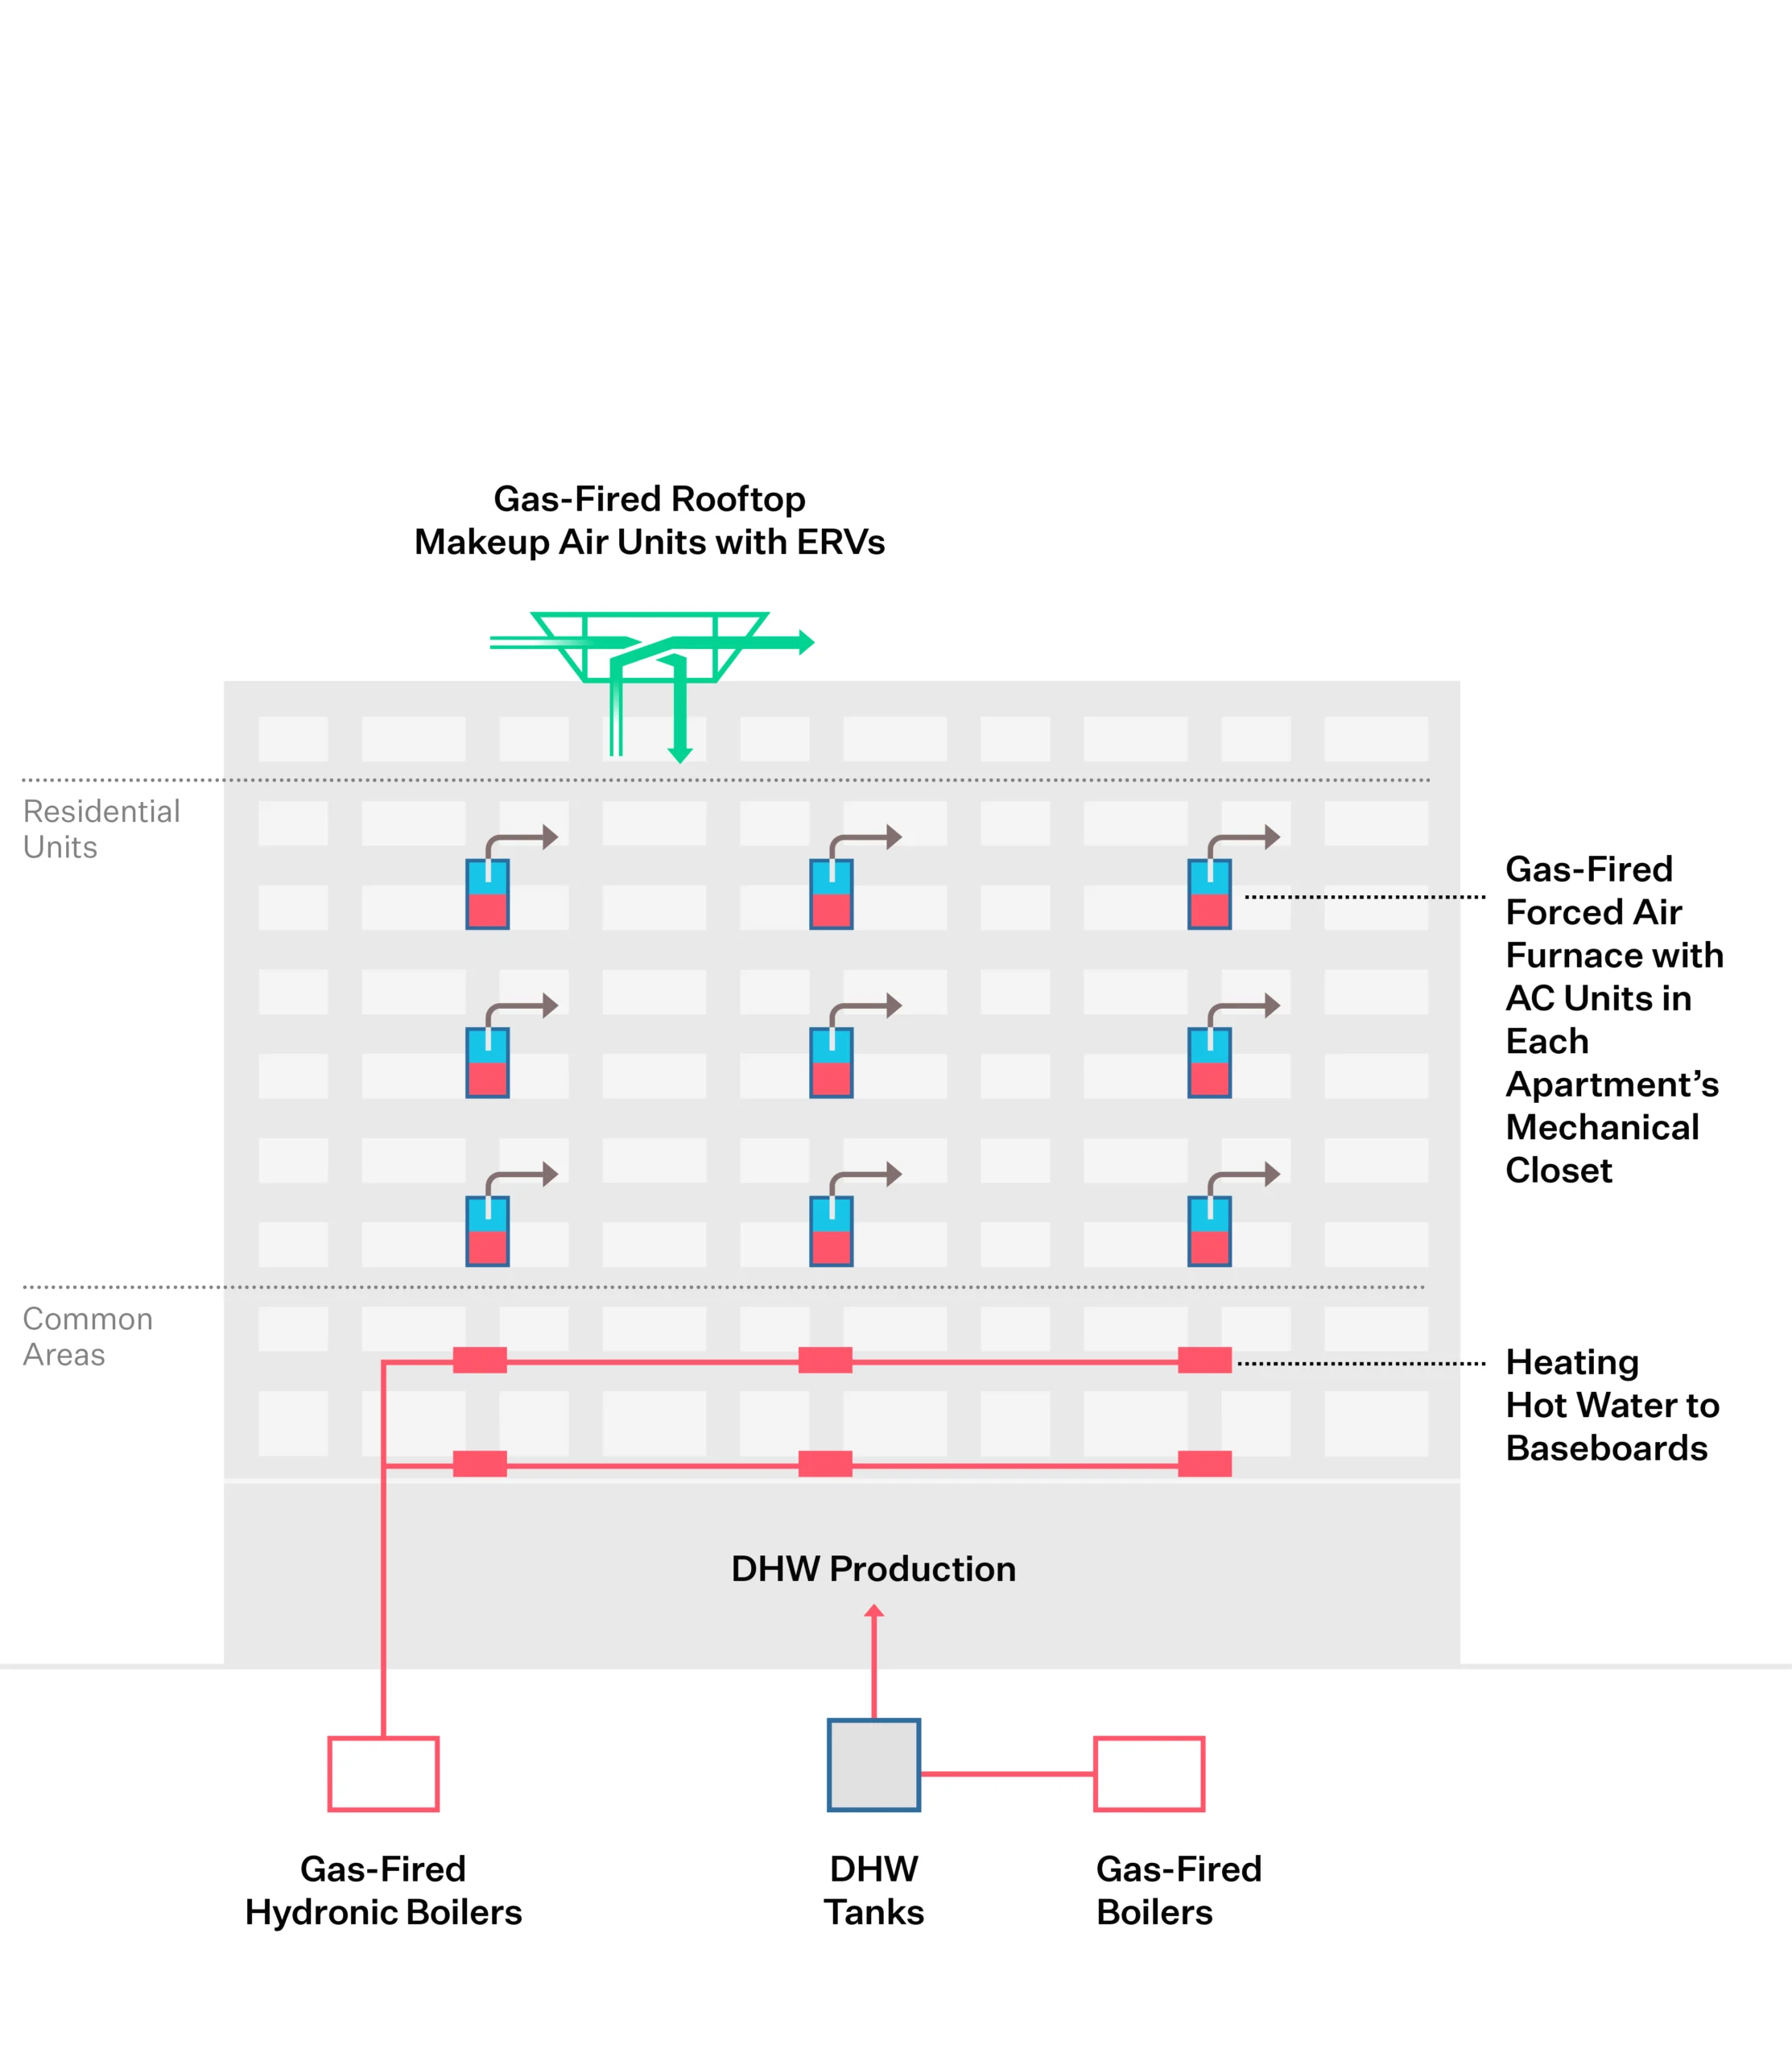
Existing Conditions
This diagram illustrates the building prior to the initiation of Strategic Decarbonization planning by the owners and their teams.
Click through the measures under “Building After” to understand the components of the building’s energy transition.
Sequence of Measures
2027
Building System Affected
heating
cooling
ventilation
Step 3
Step 3: Build the Business Case
Making a business case for strategic decarbonization requires thinking beyond a traditional energy audit approach or simple payback analysis. It assesses business-as-usual costs and risks against the costs and added value of phased decarbonization investments in the long-term.
Decarbonization Costs
$19.4M
Business-as-Usual Costs
$755,000 + $74,000 / YR
Energy cost savings: 74k / YR.
Repairs and maintenance savings: Minimal
BAU cost of system replacement/upgrades: 755k.
Business-as-Usual Risks
$0
Decarbonization Value
$7M
Incentives: ~7M (estimated).
Net Present Value
-$11.5M
The business case for decarbonization is centered around the buildings’ recapitalization cycles and a reduction in operating expenses.
The buildings currently face no potential penalties under Local Law 97 (since they are affordable housing covered under Article 321) and the operational savings are not commensurate with the cost of the Roadmap.
This is a typical situation in multifamily buildings, especially affordable housing, where the discounted cash flow analysis shows a negative present value compared to business as usual. High initial costs and the high cost per-unit of electricity compared to gas in New York City both push paybacks in an unattractive direction. A building will typically see only a handful of opportunities to fund capital projects. Incentives and tax credits are critical in making the business case for decarbonization.
Strategic Decarbonization Action Plan
An emissions decarbonization roadmap helps building owners visualize their future emissions reductions by outlining the CO2 reductions from selected energy conservation measures. This roadmap is designed with a phased approach, considering a 20- or 30-year timeline, and incorporates the evolving benefits of grid decarbonization, ensuring a comprehensive view of long-term environmental impact.
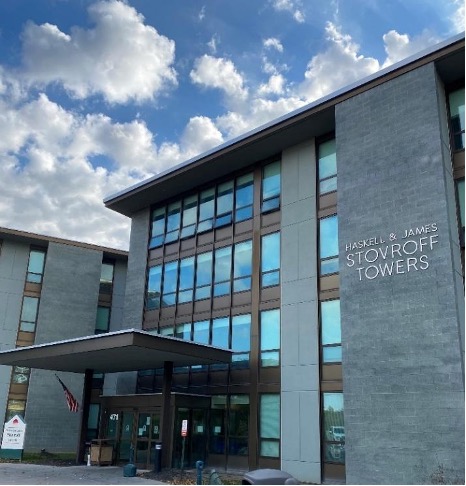
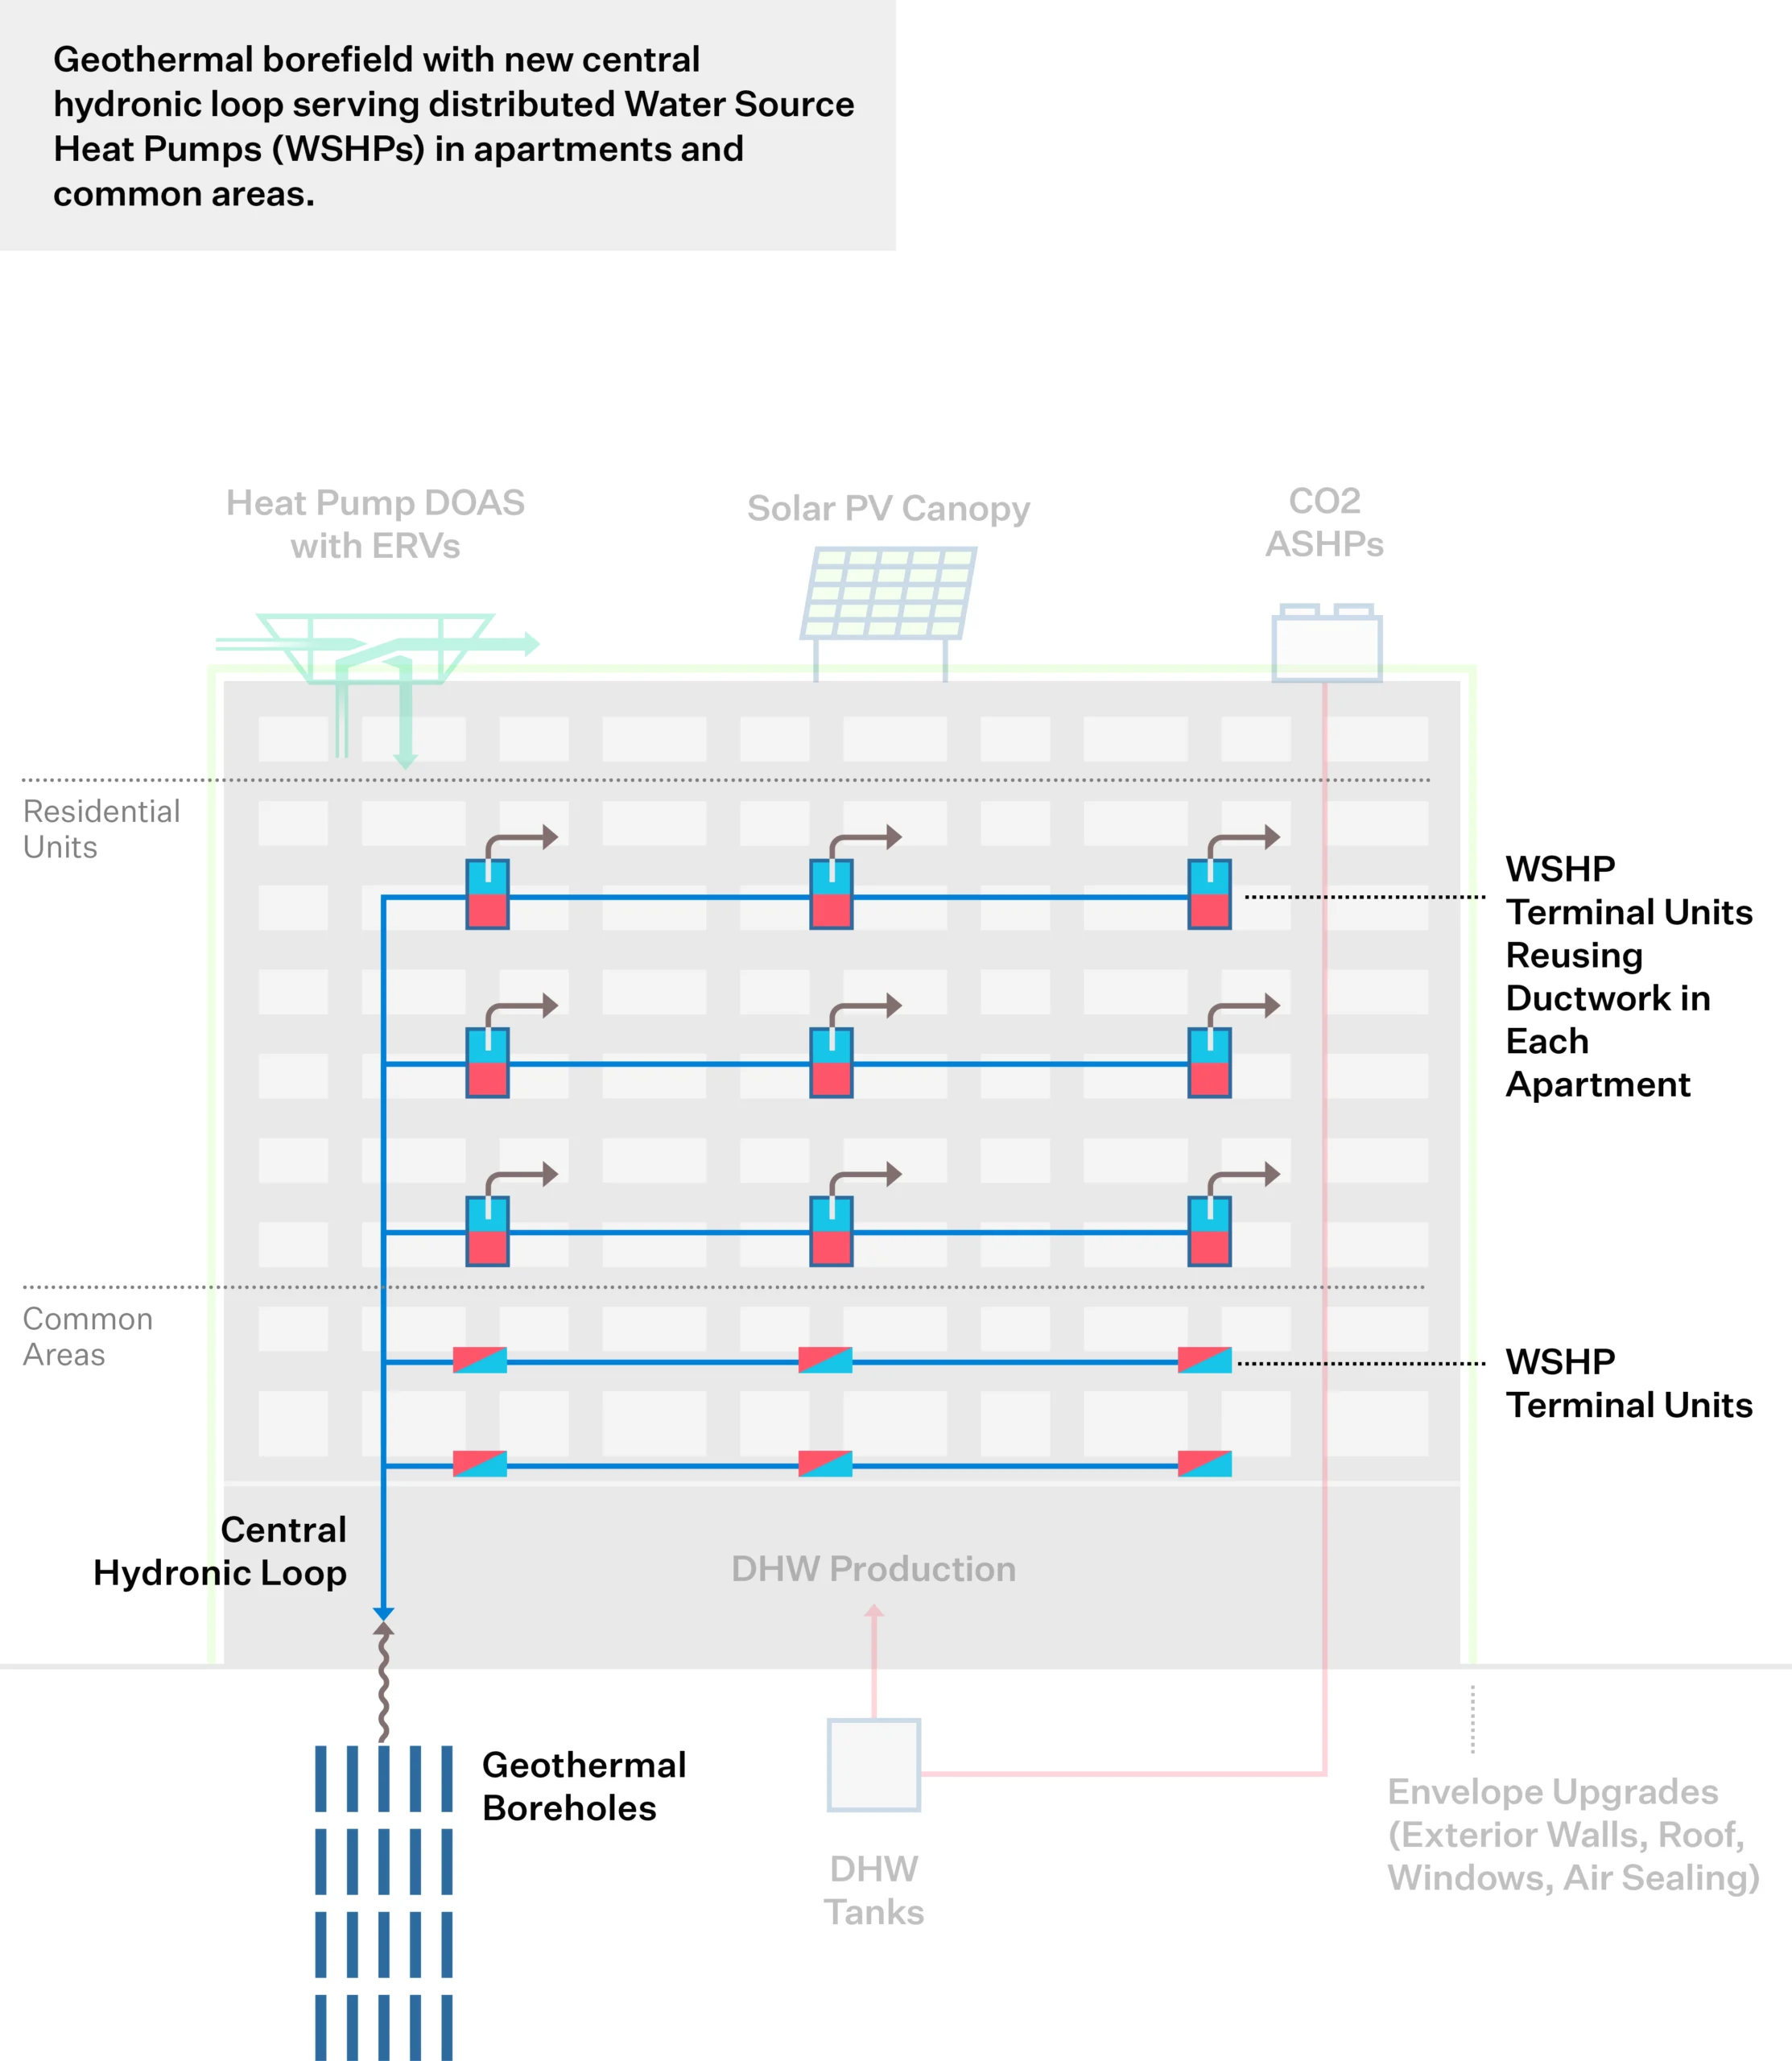
Originally built in 2003, Stovroff Towers is a four-story, 74,000 square-foot senior living facility located in Amherst, NY. WinnDevelopment (Winn) plans to acquire the Property and implement a comprehensive renovation, converting the 120 single occupancy units into eight (8) studio apartments and fifty-eight (58) one-bedroom apartments, while investing in high-efficiency, low-carbon upgrades. The retrofit project prioritizes high-performance envelope upgrades and efficient electrification to transform Stovroff Towers and reduce site energy use intensity (EUI) by 78.30%. The project will be financed in part with low-income housing tax credit (LIHTC) equity, allowing the decarbonization strategies to be implemented in a single, holistic renovation slated for completion by 2027.
Over the past decade, Winn has become an industry leader, and partner, in sustainable development, renewable energy, and building science. Winn is a long-term owner committed to tackling housing shortages and insecurity while also addressing climate change, energy equity, and resiliency for our communities. Winn is a leader in decarbonization, with several deep energy retrofit, and all-electric, high-performance projects completed or in development.
Winn has a pipeline of acquisition rehabilitation projects planned throughout the Northeast and the Mid-Atlantic. In New York State alone, Winn manages over 11,000 units of housing and owns eight (8) properties scheduled for capital improvements and/or comprehensive renovations between 2030-2040. Winn is committed to deploying elements of our Stovroff Towers scope at these other buildings as they reach recapitalization and/or at the time of equipment failure.
Project Highlights
Energy Savings
78%
The LIHTC-renovation will enhance the naturally occurring affordable housing at Stovroff Towers and preserve the property’s long-term affordability. The redevelopment project will invest in energy reduction measures that reduce site energy use intensity over 78%, transforming Stovroff Towers into a vibrant community for vulnerable populations.
Testimonial
“NYSERDA’s Empire Building Challenge (EBC) inspired a creative and efficient pre-development phase that will make the renovation of Stovroff Towers truly transformative. This Project will serve as an inspiring demonstration for similar buildings committed to reducing their carbon footprint in a meaningful way.”
Christina McPike
Vice President, Energy & Sustainability
WinnCompanies
Energy Savings
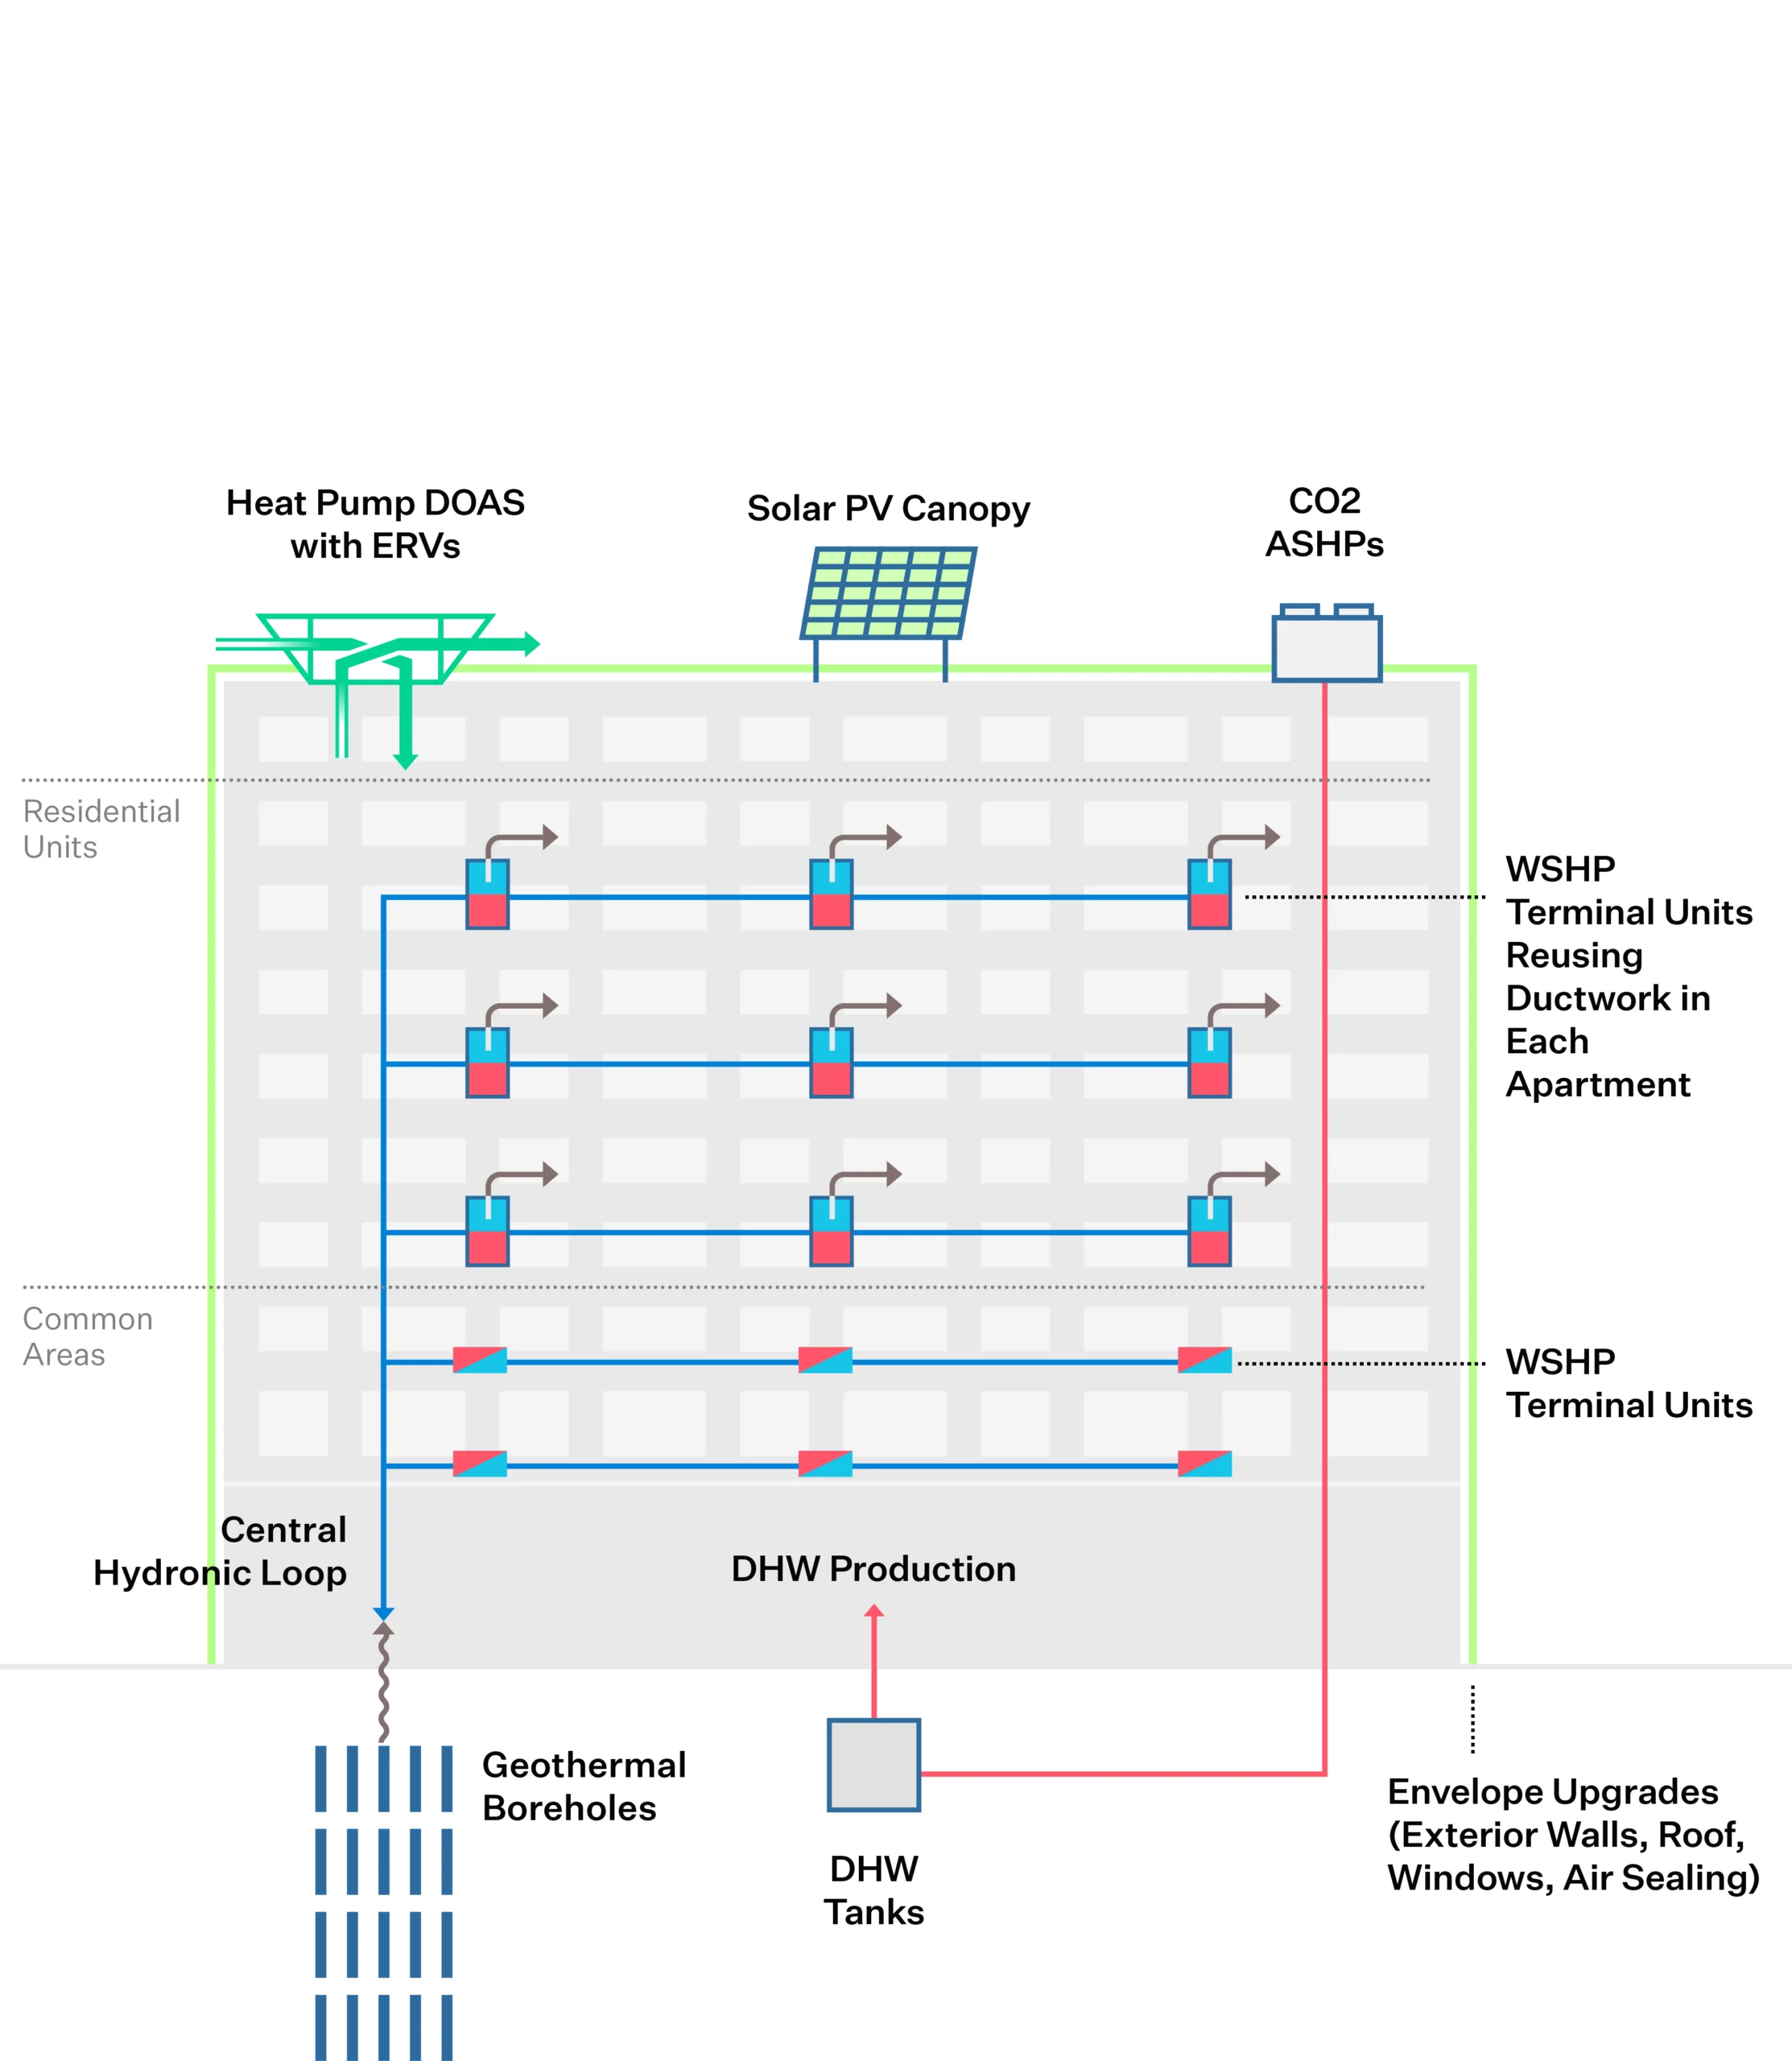
The EBC Project demonstrates geothermal and distributed hydronic systems as a replicable retrofit technology in cold climates. Stable ground temperatures will enable design of a geothermal borefield that includes 12 bores drilled to 500 ft depth, providing 34 tons of heating and cooling, which will meet 100% of the annual heating and cooling load.
Step 1
Step 1: Examine Current Conditions
A baseline assessment is key to understanding current systems and performance, then identifying conditions, requirements or events that will trigger a decarbonization effort. The assessment looks across technical systems, asset strategy and sectoral factors.
Building System Conditions
System Failure
Equipment nearing end-of-life
New heat source potential
Comfort improvements
Indoor air quality improvements
Facade maintenance
Resilience upgrades
Efficiency improvements
Asset Conditions
Repositioning
Recapitalization
Capital event cycles
Tenant turnover/vacancy
Building codes
Owner sustainability goals
Market Conditions
Technology improves
Policy changes
Since its completion, Stovroff Towers has suffered long-term programmatic issues due to single-occupancy efficiency units without full-service kitchens and limited on-site resident services. Vacancy rates have averaged 75-80%, leading to a severe operational deficit and extensive capital needs. These circumstances catalyzed Winn’s involvement at the site, which will utilize LIHTC financing from New York State’s Homes and Community Renewal (HCR) to fund a major recapitalization and comprehensive renovation that addresses capital and operational needs. Winn has a successful track record developing and preserving housing in the upstate region, where the relative cost of construction and energy is low and need for high quality affordable housing is high. The property’s existing needs informed the decarbonization scope, which will not only result in significant energy reduction and carbon emissions, but will improve the building’s passive resiliency, durability, and indoor living environment. The high efficiency all-electric equipment and building envelope upgrades will also reduce operating costs for the building owner and future residents and contribute to New York State’s building-sector decarbonization goals. The decarbonization retrofit scope is well-aligned with the Climate Leadership & Community Protection Act (CLCPA) and NYS HCR’s Existing Buildings Sustainability Guidelines and provides replicable, cost-efficient solutions that can be applied to future renovations and recapitalization events.
Step 2
Step 2: Design Resource Efficient Solutions
Effective engineering integrates measures for reducing energy load, recovering wasted heat, and moving towards partial or full electrification. This increases operational efficiencies, optimizes energy peaks, and avoids oversized heating systems, thus alleviating space constraints and minimizing the cost of retrofits to decarbonize the building over time.
Existing Conditions
This diagram illustrates the building prior to the initiation of Strategic Decarbonization planning by the owners and their teams.
Click through the measures under “Building After” to understand the components of the building’s energy transition.
Sequence of Measures
2025
Building System Affected
heating
cooling
ventilation
Step 3
Step 3: Build the Business Case
Making a business case for strategic decarbonization requires thinking beyond a traditional energy audit approach or simple payback analysis. It assesses business-as-usual costs and risks against the costs and added value of phased decarbonization investments in the long-term.
Decarbonization Costs
$13.2M
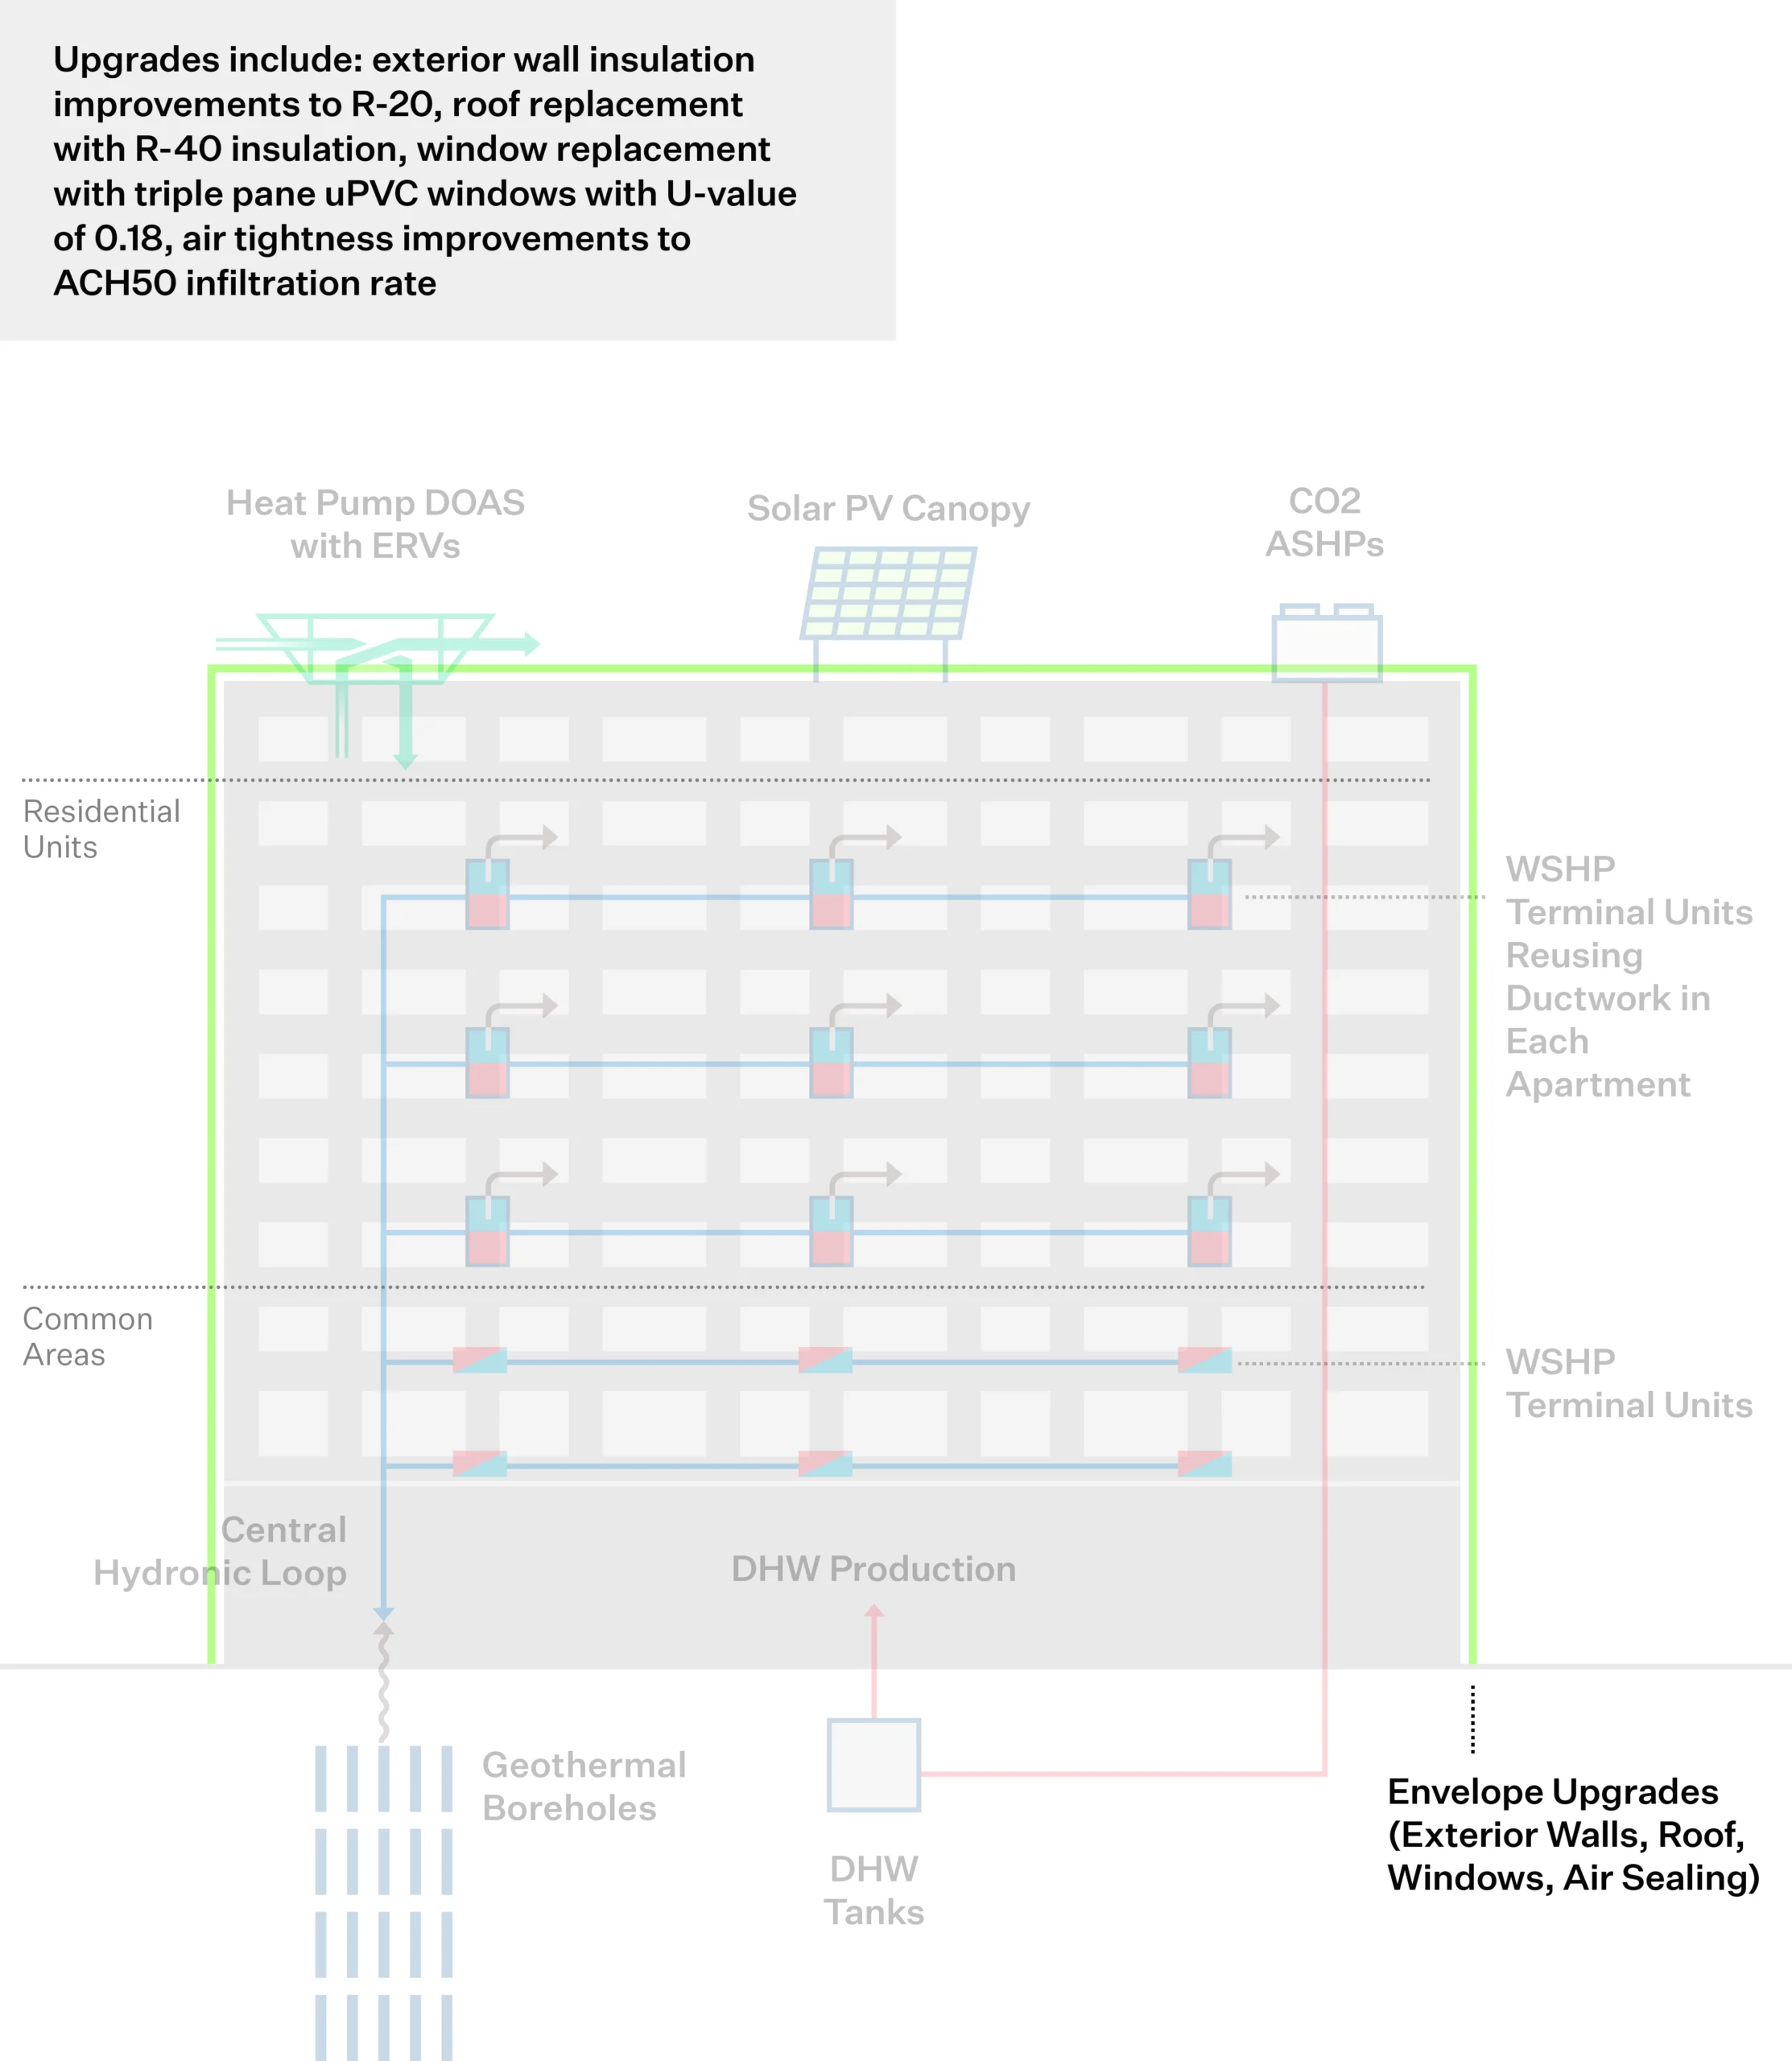
Cost of ECM #1 – Exterior Envelope Insulation: 2.5M.
Cost of ECM #2 – Triple Pane Windows: 1.2M.
Cost of ECM #3 – Roof Replacement: 1.1M.
Cost of ECM #4 – Geothermal/Water-Source-Heat-Pump System: 3.1M.
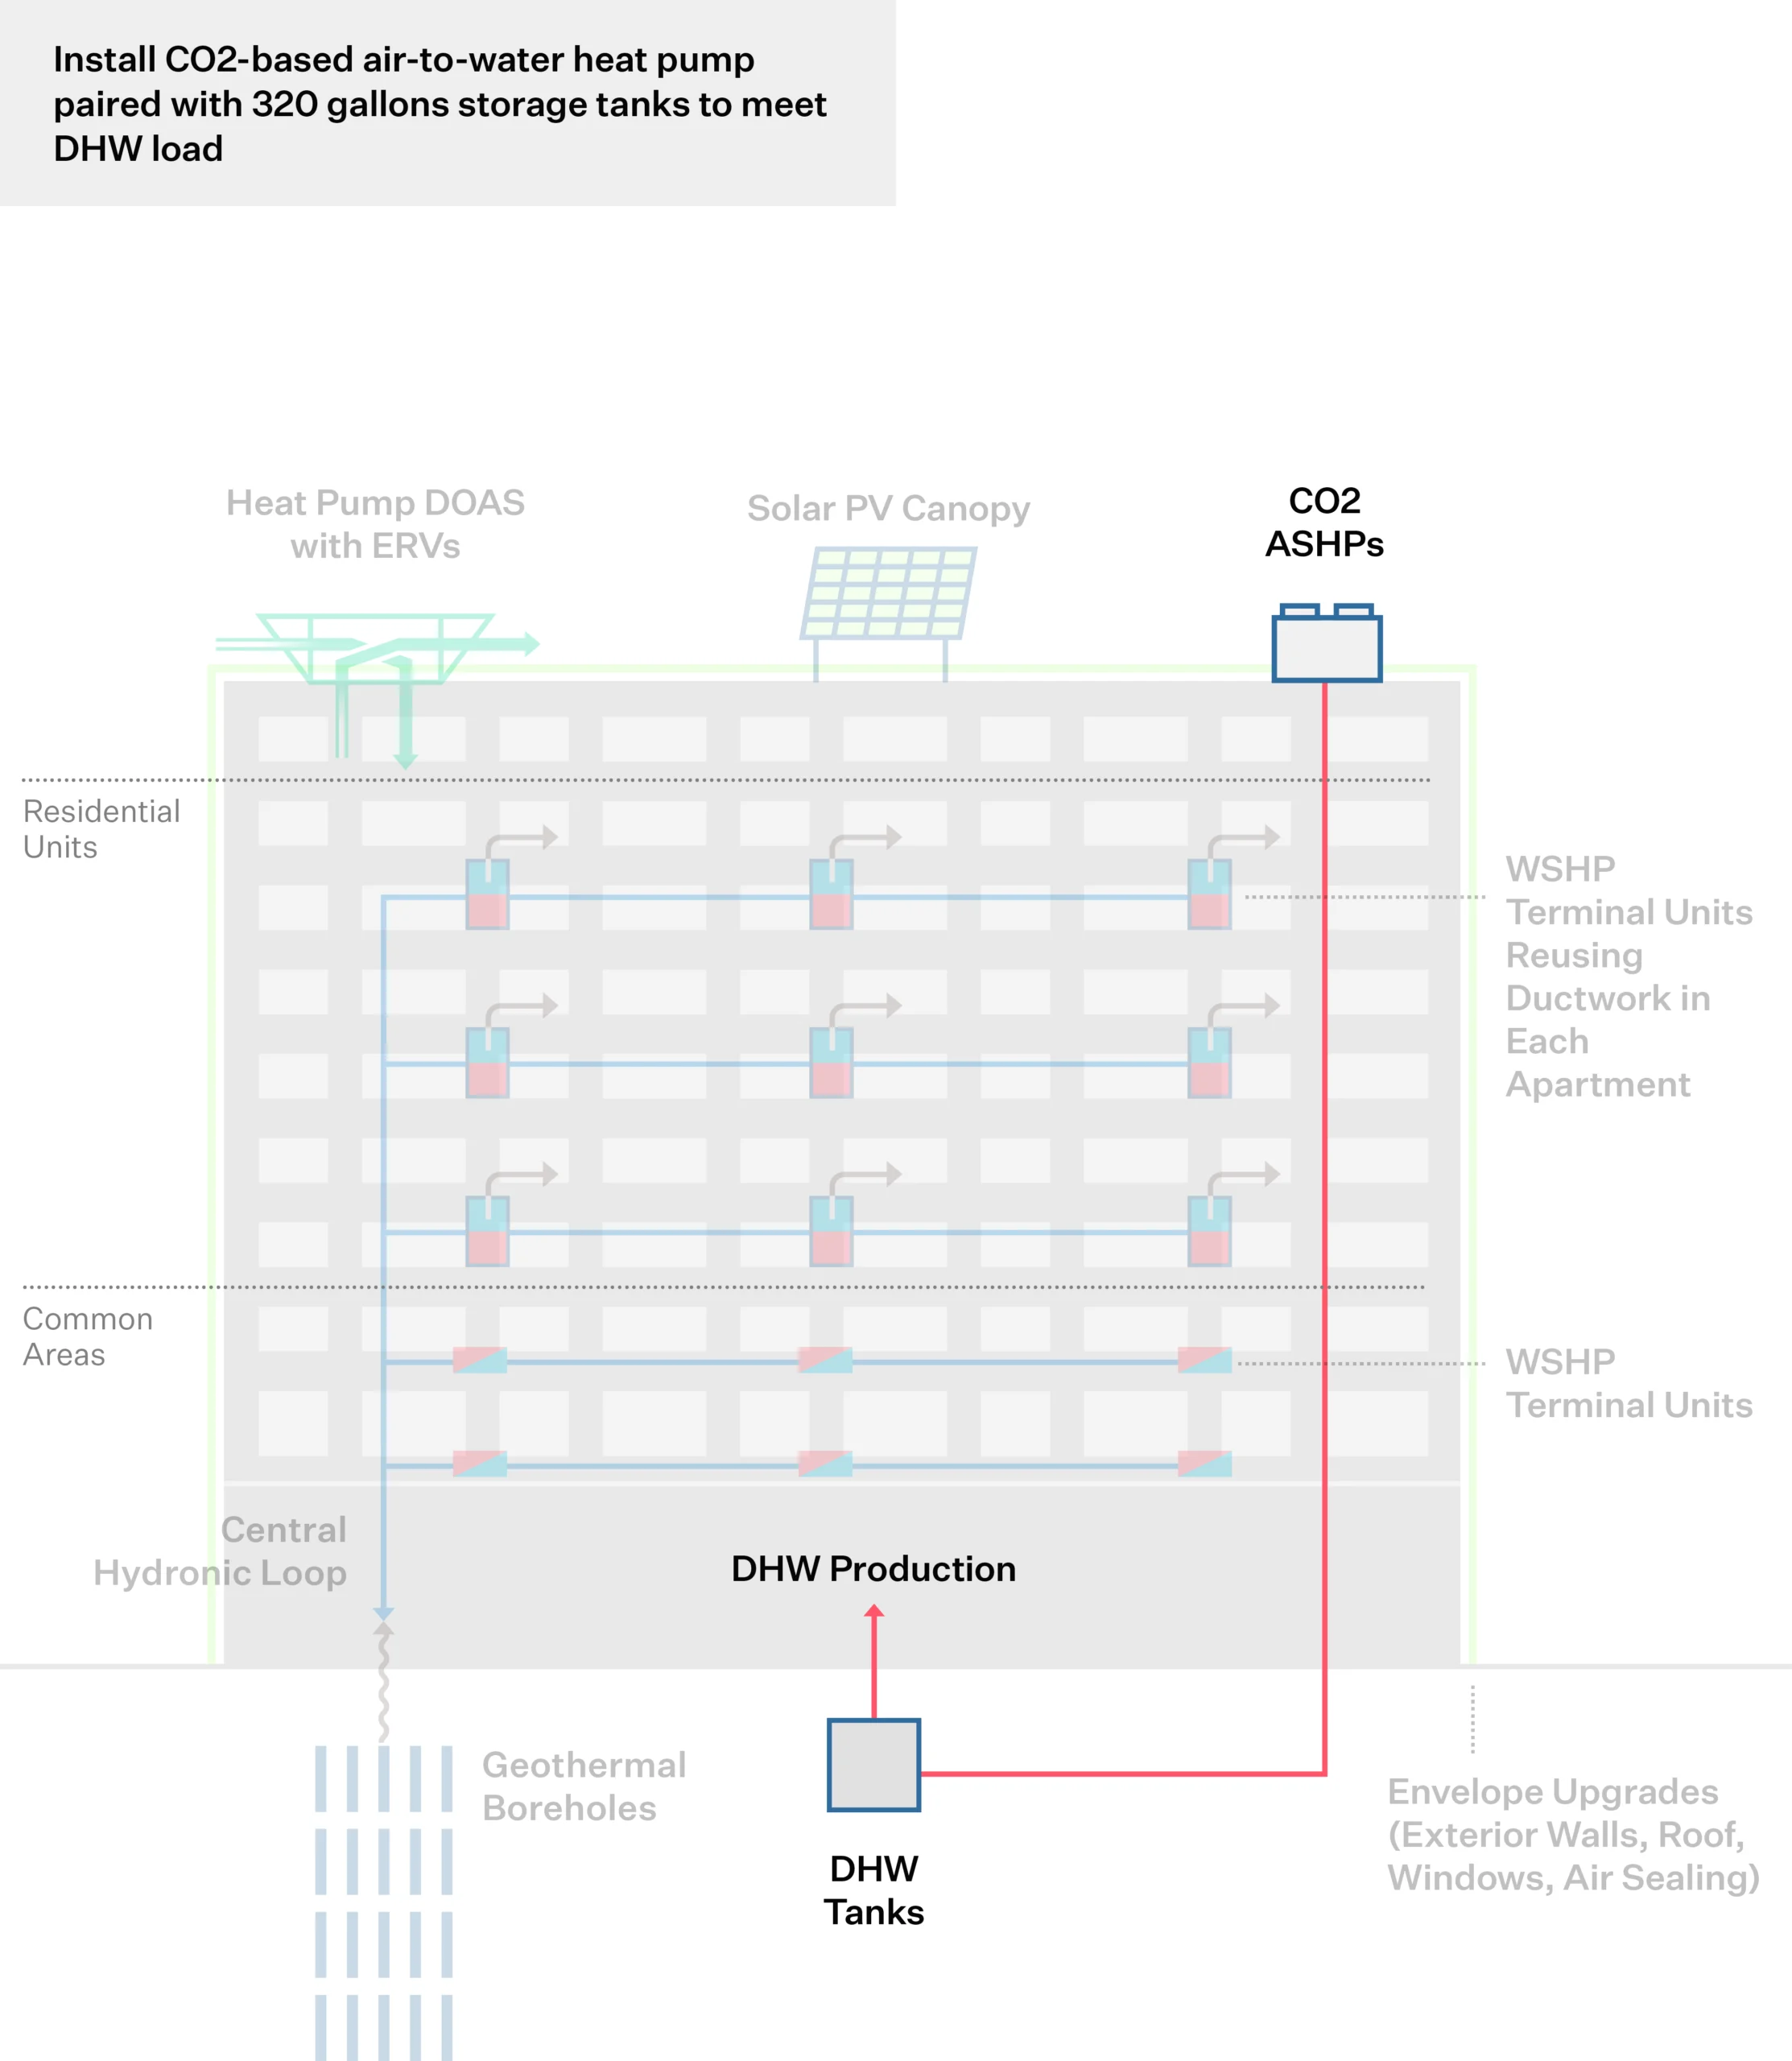
Cost of ECM #5 – DHW Central CO2 Air-to-Water Heat Pump: 805k.
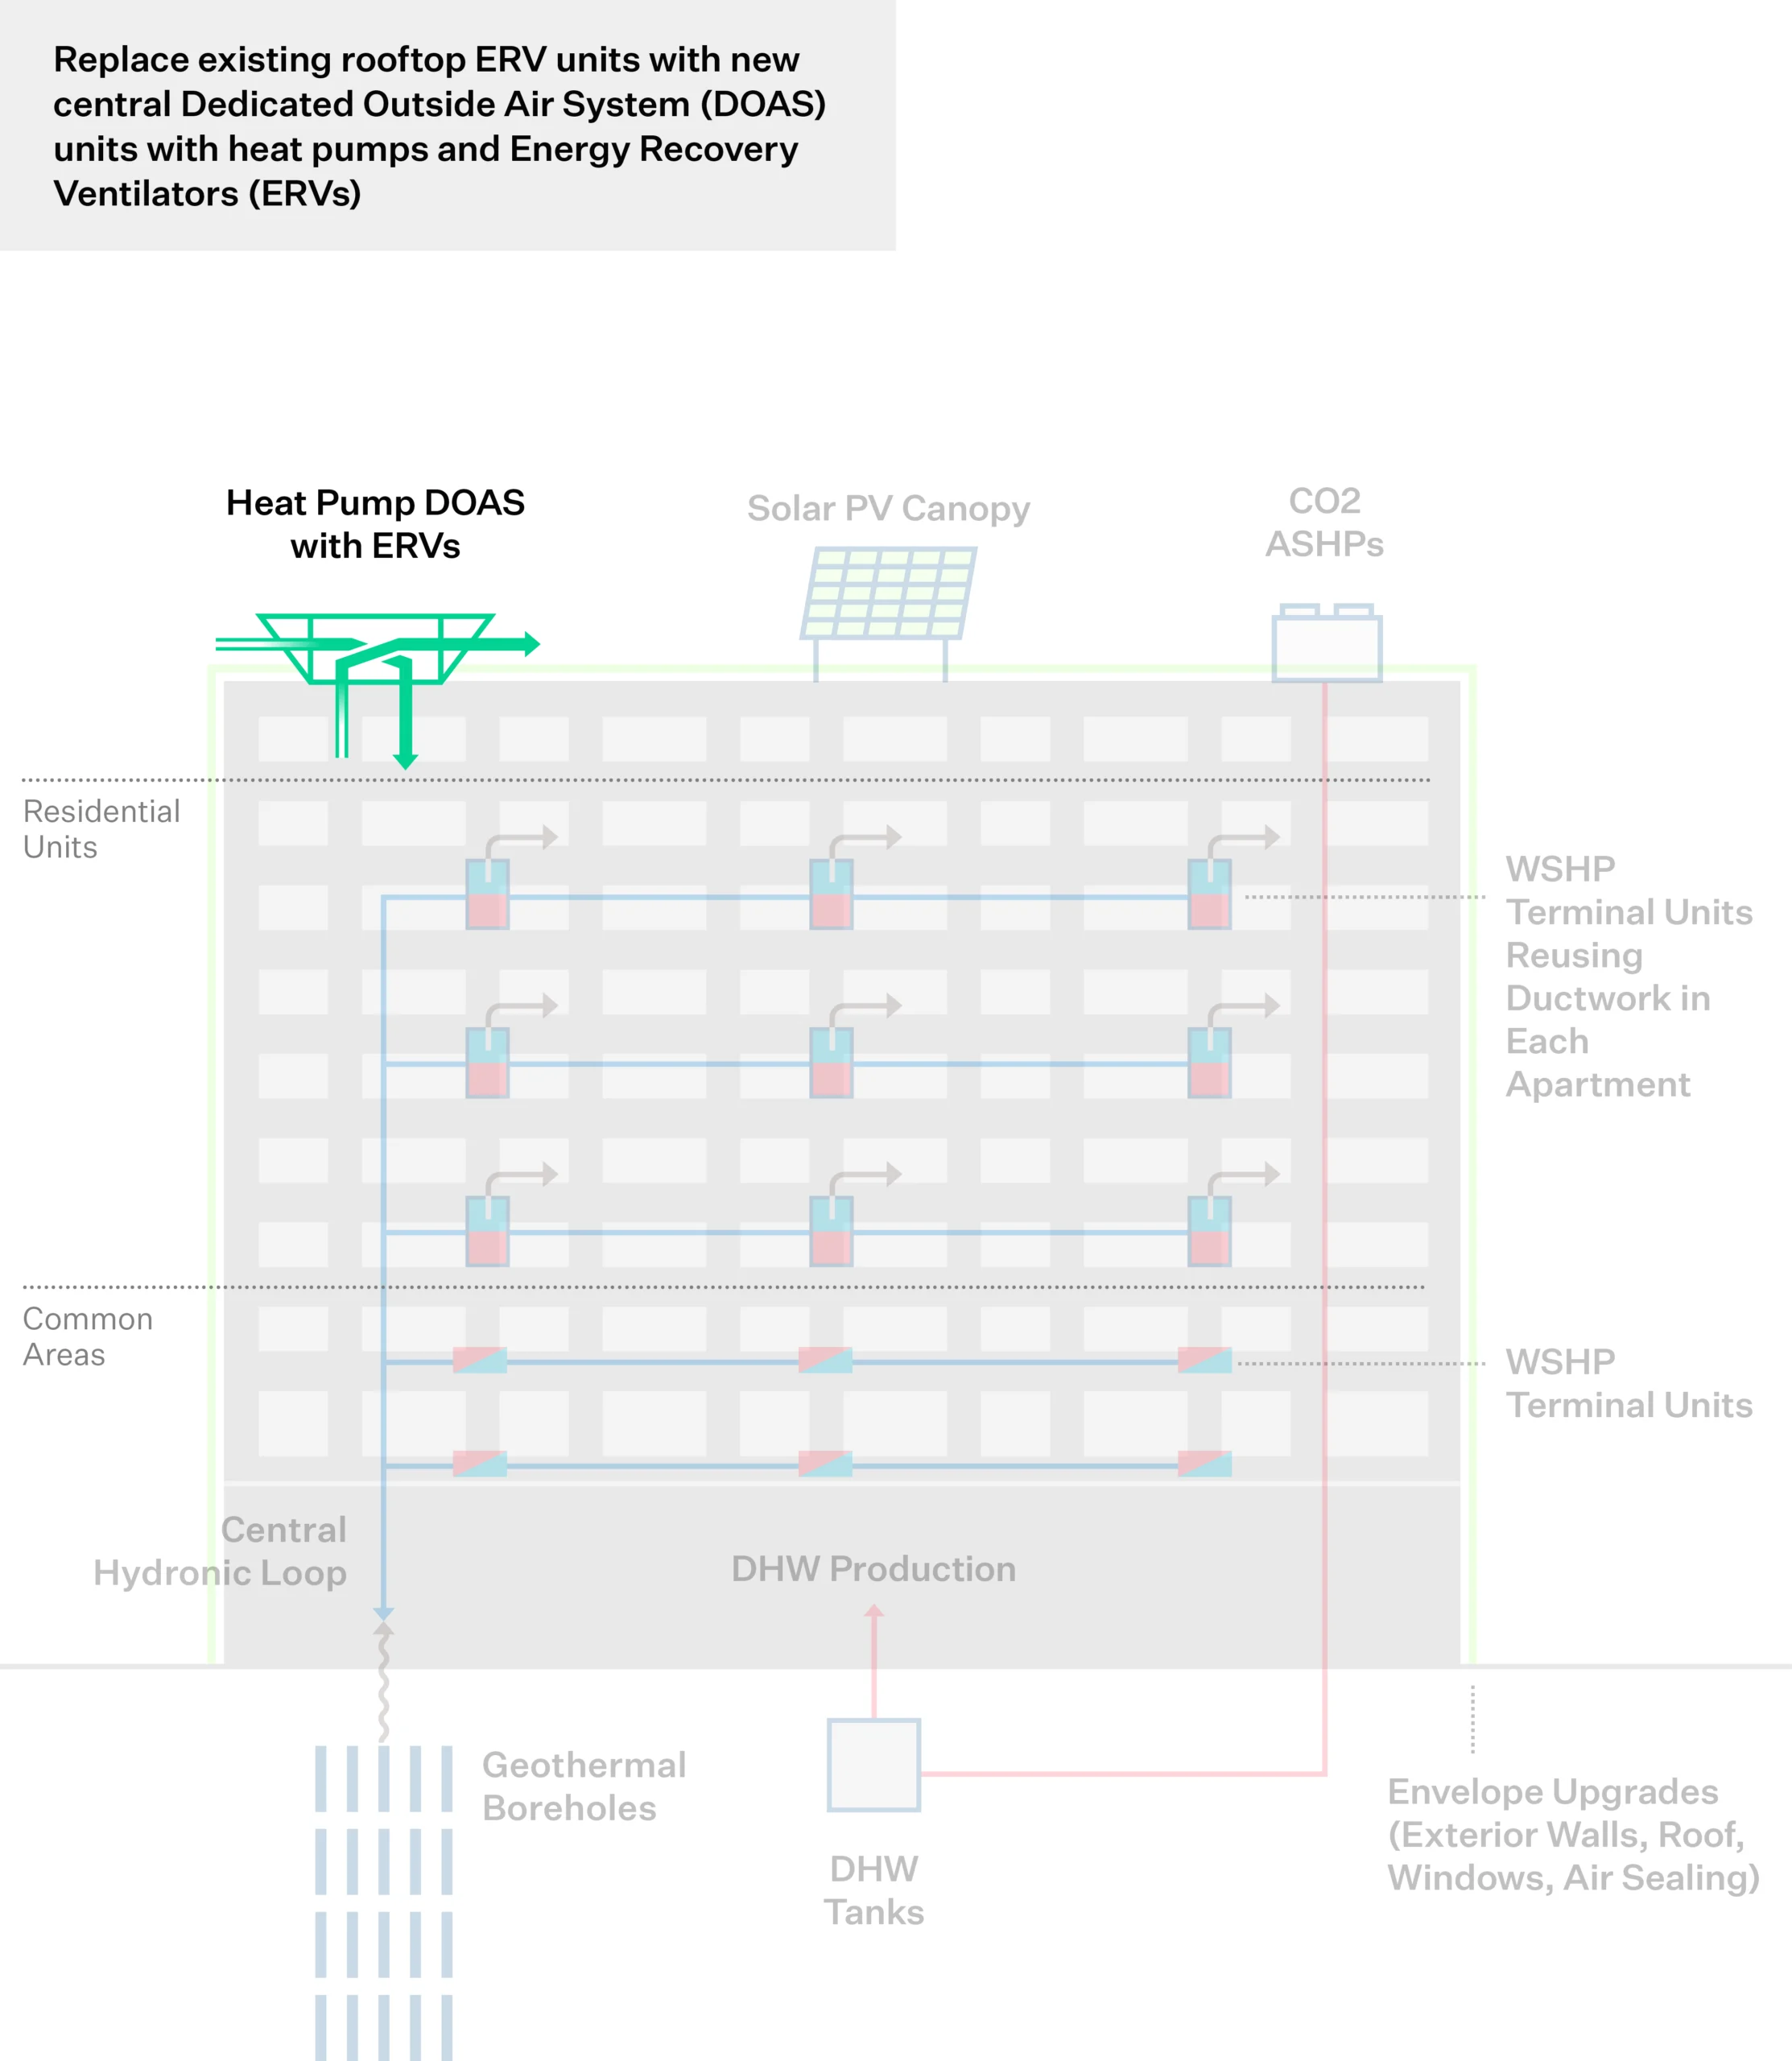
Cost of ECM #6 – Energy Recovery Ventilation: 2.2M.
Cost of ECM #7 – Electrical Upgrades: 2.1M.
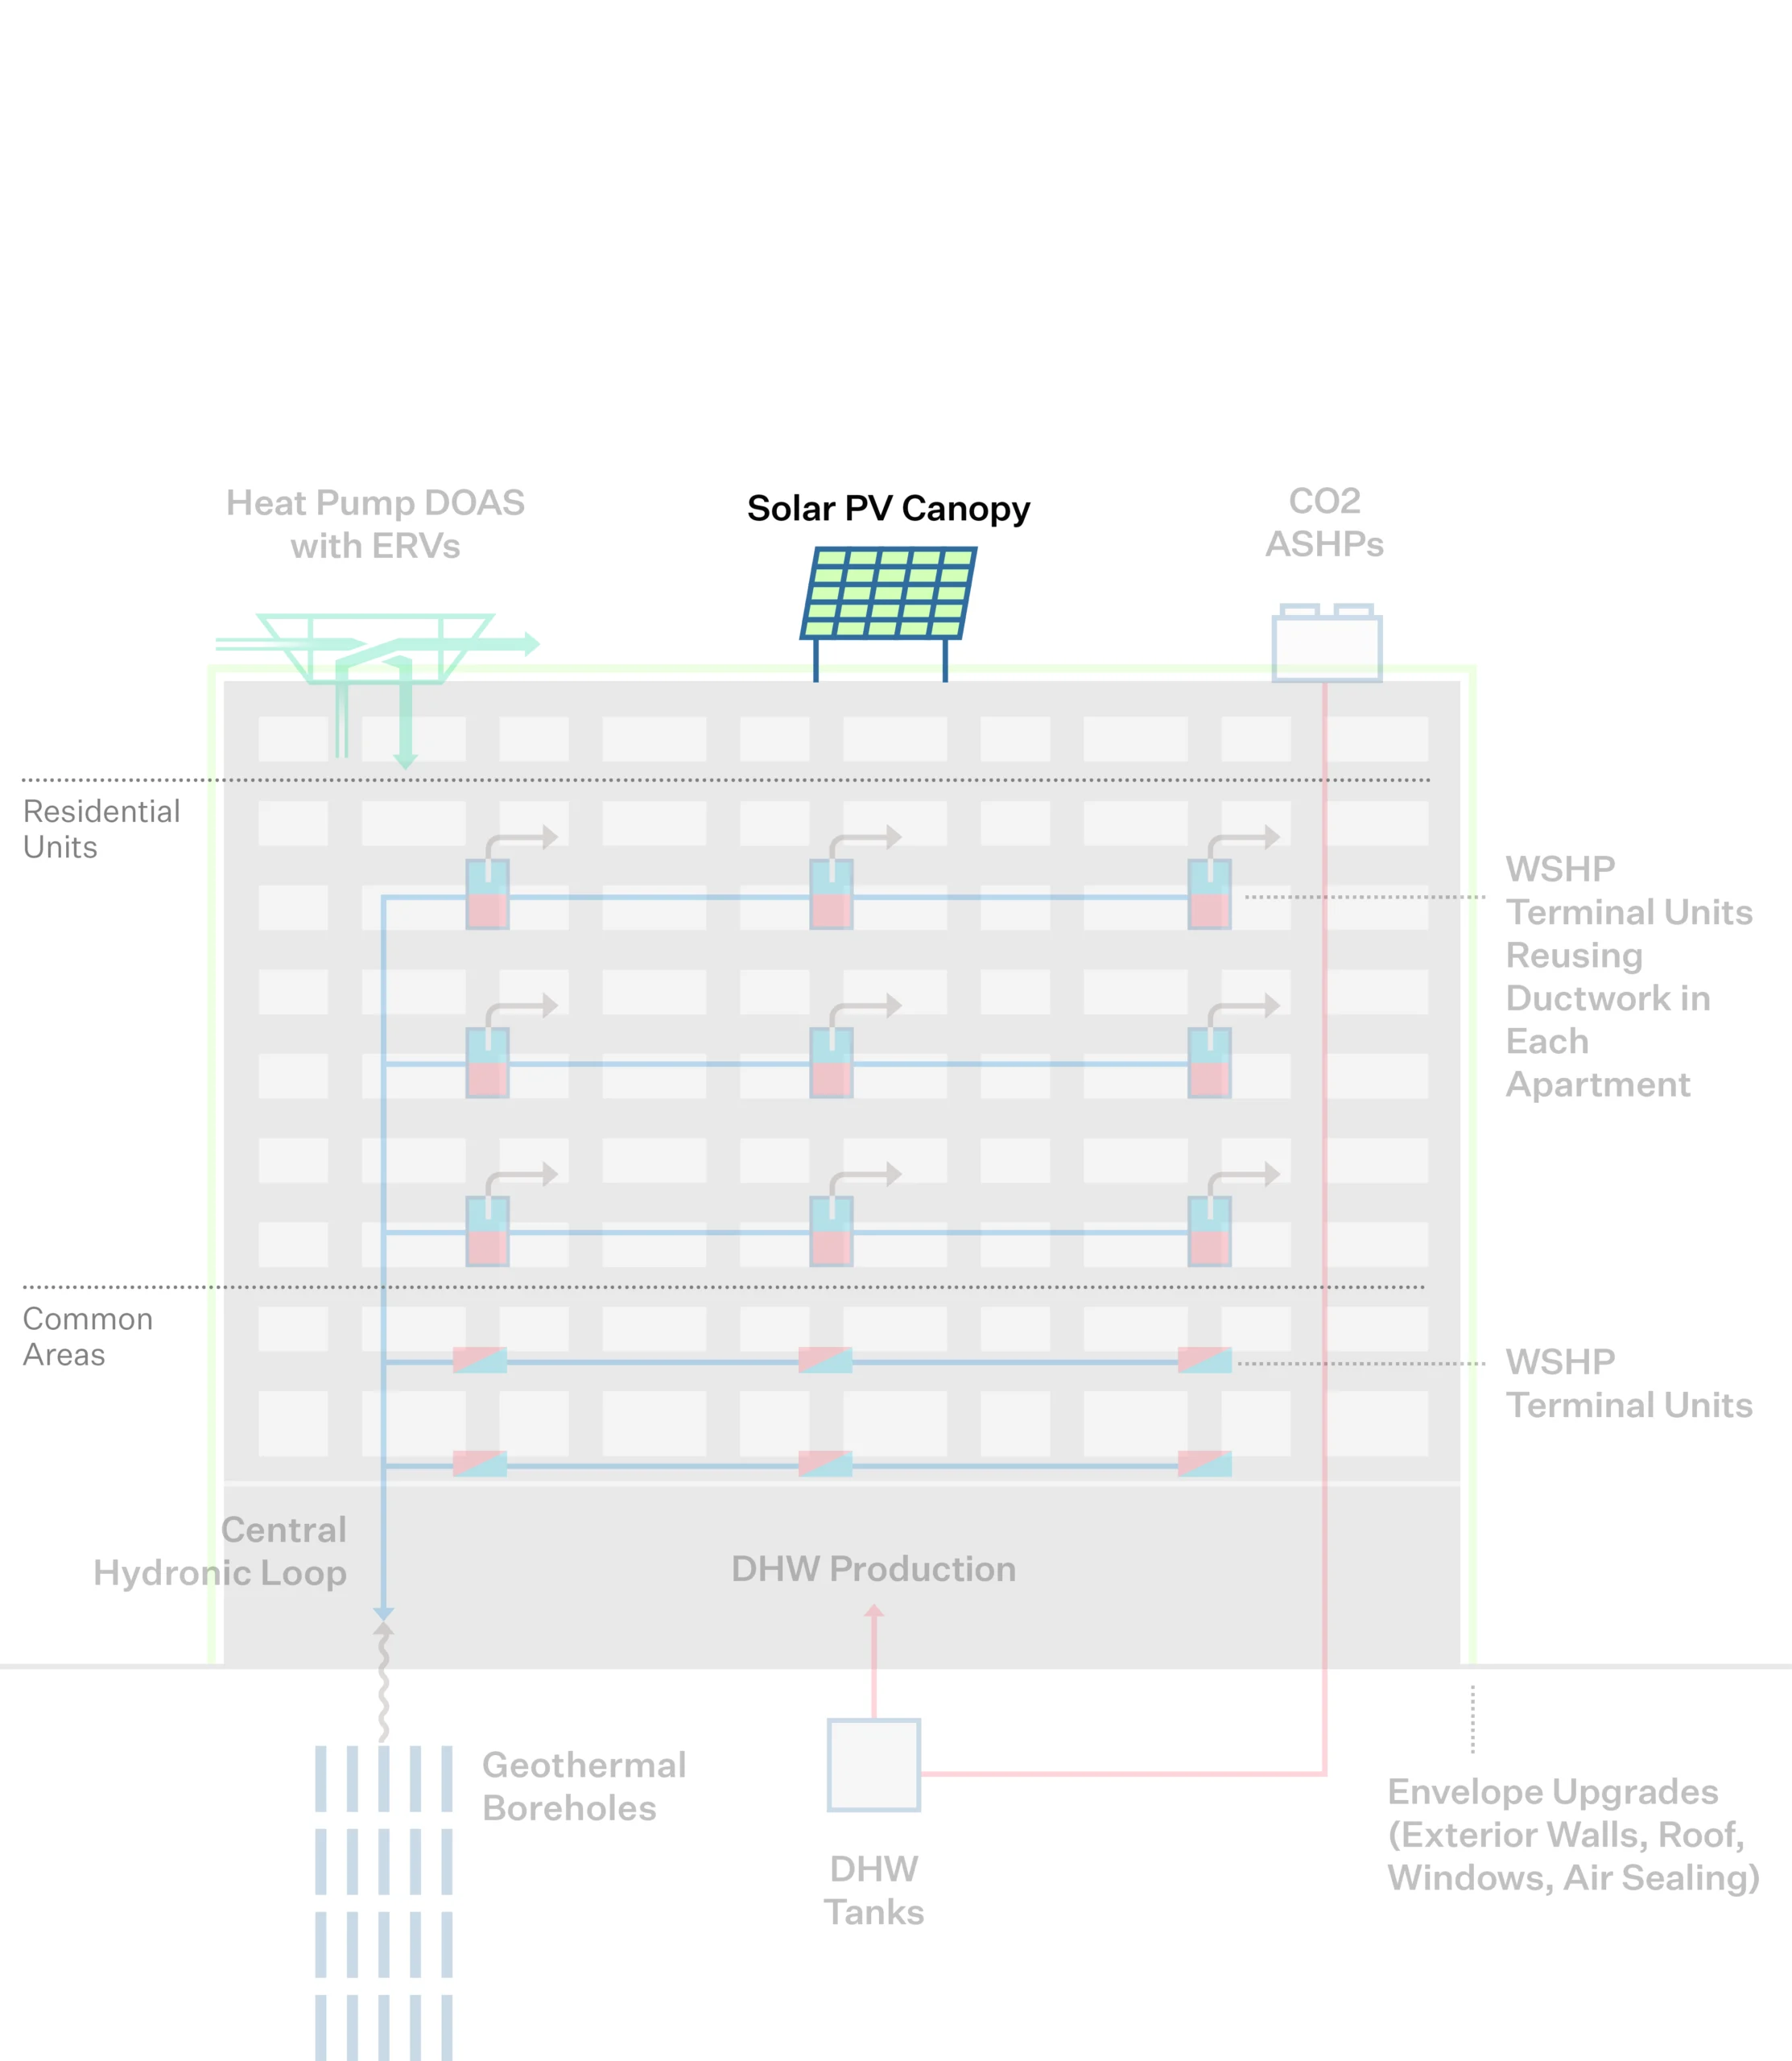
Cost of ECM #8 – Rooftop Solar PV: 194k.
Cost of ECM #9 – Smart Thermostat: included in mechanical number.
Business-as-Usual Costs
$4.6M
Energy cost savings: 37k.
BAU cost of system replacement/upgrades: 4.5M.
Business-as-Usual Risks
$0
Decarbonization Value
$8.4M
Incentives/Tax credits: 1.4M.
Valuation: 7M.
Net Present Value
TBD
Net difference between the present value of cash inflows and outflows over a period of time.
The decarbonization scope of work was selected because it achieves performance objectives while limiting capital cost, maximizing operational cost and carbon emissions savings, and preserving original architectural features important to the local community. The total cost of the ECMs is approximately $13,240,378 and the total development cost of the renovation is $43,180,406. While these costs are high, they are in line with similar deep energy retrofit projects, far more affordable than new construction, and beneficially create new deed restricted housing for the State of New York. The EBC scope is anticipated to reduce operational costs by $37,000 annually, which will help with long-term operations; however, energy cost savings alone do not support overall Project costs.
This level of investment is only possible with state resources such as NYSERDA’s Empire Building Challenge funding and LIHTC financing, which will allow Winn to create new affordable housing that is also energy efficient and fossil fuel free. In the absence of a LIHTC award, another real estate developer could acquire the property and upgrade interiors and replace systems in kind for $4.5 million, which would be a short term and short-sighted undertaking that invests in new gas infrastructure. The sustainability goals for the project are integral to the property’s transformation, the marginal cost of which cannot be supported with energy cost savings alone. However, the true net cost of ECMs, less business-as-usual in-kind replacement, NYSERDA funding, investment tax credit, and other incentives, is $4,327,764, which can be supported with debt and equity. The decarbonization roadmap provides many benefits to Stovroff Towers, including carbon neutrality by 2040, futureproofing against carbon mandates and stranded assets, and marketability. Stovroff Towers are better and stronger with the decarbonization scope and are worthy of this level of investment.
Strategic Decarbonization Action Plan
An emissions decarbonization roadmap helps building owners visualize their future emissions reductions by outlining the CO2 reductions from selected energy conservation measures. This roadmap is designed with a phased approach, considering a 20- or 30-year timeline, and incorporates the evolving benefits of grid decarbonization, ensuring a comprehensive view of long-term environmental impact.
Charrette Templates: Supporting Preliminary Retrofit Plan Review
Tags
Project Highlights
Step 1
Step 1: Examine Current Conditions
A baseline assessment is key to understanding current systems and performance, then identifying conditions, requirements or events that will trigger a decarbonization effort. The assessment looks across technical systems, asset strategy and sectoral factors.
Building System Conditions
Asset Conditions
Market Conditions
Step 2
Step 2: Design Resource Efficient Solutions
Effective engineering integrates measures for reducing energy load, recovering wasted heat, and moving towards partial or full electrification. This increases operational efficiencies, optimizes energy peaks, and avoids oversized heating systems, thus alleviating space constraints and minimizing the cost of retrofits to decarbonize the building over time.
Step 3
Step 3: Build the Business Case
Making a business case for strategic decarbonization requires thinking beyond a traditional energy audit approach or simple payback analysis. It assesses business-as-usual costs and risks against the costs and added value of phased decarbonization investments in the long-term.
Decarbonization Costs
Business-as-Usual Costs
Business-as-Usual Risks
Decarbonization Value
Net Present Value
Strategic Decarbonization Action Plan
An emissions decarbonization roadmap helps building owners visualize their future emissions reductions by outlining the CO2 reductions from selected energy conservation measures. This roadmap is designed with a phased approach, considering a 20- or 30-year timeline, and incorporates the evolving benefits of grid decarbonization, ensuring a comprehensive view of long-term environmental impact.
Project Team
Additional Resources
Tags
Charrette Overview
A charrette is a focused, collaborative convening of diverse stakeholders. In planning a building decarbonization project, charrettes are a powerful tool for establishing a holistic understanding of a building’s existing conditions and needs, aligning stakeholders, developing creative solutions, and accelerating the retrofit design process.
Context
While charrettes can be used within multiple contexts, this resource has been developed to support the review of a preliminary retrofit plan. The preliminary retrofit plan scope is developed based on existing building conditions, high-level energy data and calculations, as well as the team’s expertise and prior project experience. Having a charrette at this point in the process allows for early feedback about the retrofit scope and alignment with project goals. It provides an opportunity for collaborative problem-solving and the development of creative solutions, as multi-disciplinary stakeholders are brought together to iterate on the retrofit. More detailed energy and financial analysis will occur after the charrette and may drive scope change as the team uses results to optimize the retrofit.
Templates Overview
The following templates have been developed to reduce the effort required to include a charrette in retrofit planning and guide project teams through the charrette process. The format of the templates is intentionally basic so your organization(s)’ presentation format and logos can easily be added.
The templates are intended to be used by the design team to gather feedback and develop consensus from project stakeholders on the following topics:
Project goals
Retrofit triggers
Proposed retrofit plan
Three templates are available for download and are designed to work together. These include:
Pre-Read Template: Use this template to develop a project-specific pre-read document that can help inform the charrette discussion. This template offers a preset agenda for the charrette and provides space to clearly define project goals, trigger events, and a high-level summary of the retrofit plan. To maximize benefit from the charrette it is important that attendees arrive with a solid understanding of the information provided in the pre-read. Therefore, it is recommended the document remain as concise as possible and is sent to attendees with sufficient time for them to review.
Charrette Presentation Template: This easily customizable slide deck template provides a framework and content to guide project teams through the charrette. The intended outcomes from the charrette are level setting stakeholders on the project’s status and plans, collecting feedback, and ideation.
Post-Charrette Report Template: Use this template to capture outputs from the charrette and distribute to project stakeholders. The report is intended to support the team in coming to consensus on goals, retrofit triggers, and the preliminary retrofit plan. Once finalized, it can be used as a basis for moving into the detailed analysis phase.
Strategic Decarbonization Planning Training Series
Tags
Project Highlights
Step 1
Step 1: Examine Current Conditions
A baseline assessment is key to understanding current systems and performance, then identifying conditions, requirements or events that will trigger a decarbonization effort. The assessment looks across technical systems, asset strategy and sectoral factors.
Building System Conditions
Asset Conditions
Market Conditions
Step 2
Step 2: Design Resource Efficient Solutions
Effective engineering integrates measures for reducing energy load, recovering wasted heat, and moving towards partial or full electrification. This increases operational efficiencies, optimizes energy peaks, and avoids oversized heating systems, thus alleviating space constraints and minimizing the cost of retrofits to decarbonize the building over time.
Step 3
Step 3: Build the Business Case
Making a business case for strategic decarbonization requires thinking beyond a traditional energy audit approach or simple payback analysis. It assesses business-as-usual costs and risks against the costs and added value of phased decarbonization investments in the long-term.
Decarbonization Costs
Business-as-Usual Costs
Business-as-Usual Risks
Decarbonization Value
Net Present Value
Strategic Decarbonization Action Plan
An emissions decarbonization roadmap helps building owners visualize their future emissions reductions by outlining the CO2 reductions from selected energy conservation measures. This roadmap is designed with a phased approach, considering a 20- or 30-year timeline, and incorporates the evolving benefits of grid decarbonization, ensuring a comprehensive view of long-term environmental impact.
Project Team
Additional Resources
Tags
About the Series
NYSERDA and Building Energy Exchange, in collaboration with RMI, University of Cincinnati, and Ember Strategies, are excited to offer a comprehensive three-part Strategic Decarbonization Planning training series designed to help industry professionals tackle complex retrofit projects with confidence. Tailored for professionals in engineering, real estate, and technology, this training series will equip participants with the tools and knowledge to drive practical, cost-effective low-carbon retrofits in large buildings. Grounded in lessons learned from NYSERDA’s Empire Building Challenge and their innovative retrofit demonstration projects, participants will learn how to:
Identify effective retrofit strategies by evaluating technical solutions and real estate conditions;
Make the case for low-carbon retrofits with compelling business narratives that resonate with decision-makers; and
Turn plans into action by creating clear, step-by-step decarbonization roadmaps for real-world projects.
Live training sessions for all three courses are coming this spring. Read more about our high-impact, solutions driven training series below:
Course 1
SDP: RED Framework and Technical Solutions (1.5 AIA LU)
This first course of the series will explore Resource Efficient Decarbonization (RED) as a replicable solutions framework used to develop carbon neutrality roadmaps for large buildings in cold climates. Using real-world examples from Empire Building Challenge retrofit projects, participants will learn how to apply the RED framework to create comprehensive, long-term decarbonization plans for their buildings. Additionally, the training will review a range of technical solutions for decarbonizing buildings, highlighting how prioritization of these technologies can optimize retrofits.
SDP: Building the Business Case for Better Decarbonization (1.5 AIA LU)
The second course will focus on the finance and asset planning components of strategic decarbonization. Participants will learn how to evaluate and align technical solutions with economic realities and long-term asset strategies to inform decision-making. This course will also provide guidance on crafting compelling business case narratives that build stakeholder support and unlock investment for retrofits. By the end of the training, participants will be equipped to develop persuasive business cases that advance building decarbonization projects.
Let’s Decarbonize! A Hands-on Building Decarbonization Workshop
The third course of the series will be a highly interactive session offering a hands-on introduction to building decarbonization planning – delivered in a dynamic, game-based format. The session begins with a brief review of key concepts from the first two courses, then, participants will break into small groups to create a mock decarbonization plan for a real-world building scenario. Teams will evaluate strategies to reduce greenhouse gas emissions while weighing factors such as costs, trigger events, and other site- specific considerations. Come prepared to collaborate, apply your skills, and dive into the decision- making process behind effective building decarbonization.
This material was developed at the University of Cincinnati by Amanda Webb, Barry Abramson, Katherine Castiello Jones, and Heather Cheng. It is based upon work supported by the National Science Foundation under Award No. 2339386.
A baseline assessment is key to understanding current systems and performance, then identifying conditions, requirements or events that will trigger a decarbonization effort. The assessment looks across technical systems, asset strategy and sectoral factors.
Building System Conditions
Asset Conditions
Market Conditions
Step 2
Step 2: Design Resource Efficient Solutions
Effective engineering integrates measures for reducing energy load, recovering wasted heat, and moving towards partial or full electrification. This increases operational efficiencies, optimizes energy peaks, and avoids oversized heating systems, thus alleviating space constraints and minimizing the cost of retrofits to decarbonize the building over time.
Step 3
Step 3: Build the Business Case
Making a business case for strategic decarbonization requires thinking beyond a traditional energy audit approach or simple payback analysis. It assesses business-as-usual costs and risks against the costs and added value of phased decarbonization investments in the long-term.
Decarbonization Costs
Business-as-Usual Costs
Business-as-Usual Risks
Decarbonization Value
Net Present Value
Strategic Decarbonization Action Plan
An emissions decarbonization roadmap helps building owners visualize their future emissions reductions by outlining the CO2 reductions from selected energy conservation measures. This roadmap is designed with a phased approach, considering a 20- or 30-year timeline, and incorporates the evolving benefits of grid decarbonization, ensuring a comprehensive view of long-term environmental impact.
Project Team
Additional Resources
Tags
A global survey of 14 high-rise multifamily retrofit profiles that achieved deep energy reductions.
Retrofit Playbook Event Series: New Decarbonization Tools from ASHRAE, USGBC, and The Retrofit Playbook
Tags
Project Highlights
Step 1
Step 1: Examine Current Conditions
A baseline assessment is key to understanding current systems and performance, then identifying conditions, requirements or events that will trigger a decarbonization effort. The assessment looks across technical systems, asset strategy and sectoral factors.
Building System Conditions
Asset Conditions
Market Conditions
Step 2
Step 2: Design Resource Efficient Solutions
Effective engineering integrates measures for reducing energy load, recovering wasted heat, and moving towards partial or full electrification. This increases operational efficiencies, optimizes energy peaks, and avoids oversized heating systems, thus alleviating space constraints and minimizing the cost of retrofits to decarbonize the building over time.
Step 3
Step 3: Build the Business Case
Making a business case for strategic decarbonization requires thinking beyond a traditional energy audit approach or simple payback analysis. It assesses business-as-usual costs and risks against the costs and added value of phased decarbonization investments in the long-term.
Decarbonization Costs
Business-as-Usual Costs
Business-as-Usual Risks
Decarbonization Value
Net Present Value
Strategic Decarbonization Action Plan
An emissions decarbonization roadmap helps building owners visualize their future emissions reductions by outlining the CO2 reductions from selected energy conservation measures. This roadmap is designed with a phased approach, considering a 20- or 30-year timeline, and incorporates the evolving benefits of grid decarbonization, ensuring a comprehensive view of long-term environmental impact.
Project Team
Additional Resources
Tags
As climate-forward policies have gained momentum and high-performance building technologies have continued to advance, building owners are feeling increasing pressure to decarbonize while navigating a growing array of retrofit options and requirements. How can project teams chart a course through this evolving and overwhelming landscape to confidently plan and implement decarbonization retrofits?
The newly released Guide to Strategic Decarbonization Planning, produced by ASHRAE, U.S. Green Building Council (USGBC), and supported by New York State Energy Research and Development Authority (NYSERDA), presents a comprehensive suite of best practices to operationalize deep decarbonization in buildings by following the strategic decarbonization planning (SDP) framework. SDP is a proven approach to decarbonization planning that integrates holistic technical solutions with pragmatic asset management strategies, enabling project teams to deliver cost-effective, flexible decarbonization projects.
Join ASHRAE, USGBC, and the Retrofit Playbook for Large Buildings team on September 23rd to learn more about the Guide to Strategic Decarbonization Planning and explore how it connects with the tools, case studies, and planning resources available on the RetrofitPlaybook.org. Whether you’re just getting started or refining a long-term roadmap, this session will help you learn how to apply the SDP framework and other practical resources to actualize low-carbon, future-ready building retrofits.
Opening Remarks
Sophie Cardona, Senior Project Manager, NYSERDA
Moderator
Molly Dee-Ramasamy, Director of Deep Carbon Reduction Group, JBB
Presenters
Laurie Kerr, Principal Climate Advisor, USGBC Phil Keuhn, Principal, RMI
Panelists
Adam Hinge, Managing Director, Sustainable Energy Partnerships Laurie Kerr, Principal Climate Advisor, USGBC Phil Keuhn, Principal, RMI Laura Humphrey, Senior Director of Energy & Sustainability, L+M Development Partners
The Role of Design Charrettes in Building Decarbonization Planning
Tags
Project Highlights
Step 1
Step 1: Examine Current Conditions
A baseline assessment is key to understanding current systems and performance, then identifying conditions, requirements or events that will trigger a decarbonization effort. The assessment looks across technical systems, asset strategy and sectoral factors.
Building System Conditions
Asset Conditions
Market Conditions
Step 2
Step 2: Design Resource Efficient Solutions
Effective engineering integrates measures for reducing energy load, recovering wasted heat, and moving towards partial or full electrification. This increases operational efficiencies, optimizes energy peaks, and avoids oversized heating systems, thus alleviating space constraints and minimizing the cost of retrofits to decarbonize the building over time.
Step 3
Step 3: Build the Business Case
Making a business case for strategic decarbonization requires thinking beyond a traditional energy audit approach or simple payback analysis. It assesses business-as-usual costs and risks against the costs and added value of phased decarbonization investments in the long-term.
Decarbonization Costs
Business-as-Usual Costs
Business-as-Usual Risks
Decarbonization Value
Net Present Value
Strategic Decarbonization Action Plan
An emissions decarbonization roadmap helps building owners visualize their future emissions reductions by outlining the CO2 reductions from selected energy conservation measures. This roadmap is designed with a phased approach, considering a 20- or 30-year timeline, and incorporates the evolving benefits of grid decarbonization, ensuring a comprehensive view of long-term environmental impact.
Project Team
Additional Resources
Tags
As the world grapples with the urgent need to reduce greenhouse gas emissions, the built environment has become a critical focus area to deliver progress. Buildings are significant contributors to global carbon emissions, and transitioning to more sustainable, low-carbon operations is essential for meeting climate goals. Planning for that transition now, through a thoughtful and rational approach, is key to achieving success over time.
Design charrettes are an important tool project teams can use to support their decarbonization planning work. These collaborative design review workshops bring together diverse stakeholders to develop and refine strategies for reducing carbon emissions from buildings over time.
What is a Design Charrette?
A design charrette is an intensive, multi-disciplinary workshop aimed at finding and refining solutions to complex problems. The term originated in 19th century Paris and refers to the practice of design students working intensely on their projects until the last minute, when a cart or “charrette” would be wheeled around to collect their final designs. The term has evolved to describe collaborative sessions that bring together developers, designers, domain experts, community members, and an array of other stakeholders to reach mutually beneficial outcomes. In the context of building decarbonization, design charrettes facilitate the rapid development of actionable (and at times substantially more innovative) strategies to reduce emissions from buildings, with alignment among multiple interested parties.
Why Use Design Charrettes to Achieve Resource Efficient Decarbonization?
Collaborative Problem-Solving: Building decarbonization requires input from a wide range of experts, including architects, engineers, asset managers, environmental scientists, and community leaders. A design charrette brings these diverse voices together in a collaborative setting, ensuring that all perspectives are considered.
Intensive Focus: The concentrated nature of a charrette allows participants to delve deeply into the problem at hand. Over several hours (or days), stakeholders can explore various scenarios, analyze data, and develop detailed plans that might otherwise take months to create using traditional methods.
Iterative Process: Charrettes are designed to be iterative, with multiple rounds of feedback and refinement as needed. This approach ensures that the final outcomes are well-vetted and robust, with broad support from all stakeholders.
Creative Solutions: The collaborative and open nature of charrettes fosters creativity and challenges deeply held assumptions about how to approach a problem by the charrette participants. Participants are encouraged to think outside the box and develop innovative solutions that might not emerge in a more conventional planning process.
Achieving Resource Efficient Decarbonization (RED): Charrettes enable stakeholders to develop highly strategic plans to transition a building away from on-site fossil fuel over time in a way that does not diminish high-performance operations, contains operating and capital expenses, and maintains a complex urban systems perspective including considerations relating to infrastructure and natural resources.
The Design Charrette Process
Charrettes are conducted just after a decarbonization concept plan is created and initial decarbonization measures are framed. A successful charrette requires being prepared to discuss the existing conditions of the building in detail, various decarbonization measures and approaches considered, and an understanding of the social and market conditions influencing the building owner’s decision making. The charrette process includes:
Preparation: Successful charrettes require careful preparation. This includes identifying key stakeholders and inviting them to join, gathering relevant data, and setting clear objectives for the workshop.
Workshop Session: During the charrette, the project team presents their building existing conditions and decarbonization approaches and engage in brainstorming, design review, and business discussions with a team of technical experts and industry leaders.
Iteration and Feedback: Ideas generated during the sessions can be reviewed and refined through multiple rounds of feedback and additional charrettes as needed. This iterative process helps to improve and perfect the proposed solutions.
Implementation and Follow-Up: The final step is to translate the charrette outcomes into a formal strategic decarbonization plan and business case that leads to real-world actions. This may involve further planning, securing funding, and ongoing community engagement.
Design charrettes are a powerful tool for addressing complex decarbonization challenges, especially in the planning and early implementation phase. With collaboration, creativity, and iteration, charrettes enable the development of effective and sustainable strategies to reduce carbon emissions from buildings.
Want to review your decarbonization plan with our team of experts?
A baseline assessment is key to understanding current systems and performance, then identifying conditions, requirements or events that will trigger a decarbonization effort. The assessment looks across technical systems, asset strategy and sectoral factors.
Building System Conditions
Asset Conditions
Market Conditions
Step 2
Step 2: Design Resource Efficient Solutions
Effective engineering integrates measures for reducing energy load, recovering wasted heat, and moving towards partial or full electrification. This increases operational efficiencies, optimizes energy peaks, and avoids oversized heating systems, thus alleviating space constraints and minimizing the cost of retrofits to decarbonize the building over time.
Step 3
Step 3: Build the Business Case
Making a business case for strategic decarbonization requires thinking beyond a traditional energy audit approach or simple payback analysis. It assesses business-as-usual costs and risks against the costs and added value of phased decarbonization investments in the long-term.
Decarbonization Costs
Business-as-Usual Costs
Business-as-Usual Risks
Decarbonization Value
Net Present Value
Strategic Decarbonization Action Plan
An emissions decarbonization roadmap helps building owners visualize their future emissions reductions by outlining the CO2 reductions from selected energy conservation measures. This roadmap is designed with a phased approach, considering a 20- or 30-year timeline, and incorporates the evolving benefits of grid decarbonization, ensuring a comprehensive view of long-term environmental impact.
Project Team
Additional Resources
Tags
Insights from the Empire Building Challenge
The Strategic Decarbonization Assessment calculator is a valuable tool that allows building owners and retrofit teams to align their asset decarbonization strategies with their capital investment strategies. The SDA is designed to integrate assessment of multiple requirements including optimizing net present value, replacing equipment close to end of life, avoiding compliance fees, and coordinating electrification of fossil fuel equipment with future electric grid decarbonization.
The SDA is a long-term financial planning tool for building owners to manage carbon emissions and energy use. During the Empire Building Challenge program, the tool guided participants in refining their decarbonization scenarios and identifying the most cost-effective decarbonization plans. Several teams were able to show positive net present value for their decarbonization plans compared to business as usual. This process can benefit many buildings and property owners in New York in better quantifying, representing, and identifying optimal decarbonization scenarios.
The SDA tool was built by Arup and Ember Strategies. It was previously developed for the San Francisco Department of the Environment and modified for NYSERDA use in the Empire Building Challenge.
The SDA tool was created as the one-stop shop for the development and modeling of the business case that supports initiating a decarbonization roadmap. The SDA tool below was developed based on ASHRAE Standard 211 normative forms with a variety of users and use cases across the United States in mind.
The tables and charts on the “Summary (Print Me)” tab outline assumptions, costs, savings, decarbonization trajectory and alignment with NYC’s LL97 requirements. The bar charts and trajectories on this tab should be a graphical representation of the narrative explanation of your plan and business case from the “Narrative & Measures” and “Alternatives” tabs. The “Carbon emissions per year, before offsets” and the “Relative NPV of Alternatives” charts on the “Summary (Print Me)” tab should illustrate the sequencing and timing of equipment replacement, relationships between ECMs and savings/costs.
SDA Inputs Table
The table below describes inputs of the SDA tool and directions associated with each.
On the “Building info and assumptions” tab, users input basic information about the building: floor areas, space types, fuel types and consumption (bill) data. The “Building info and assumptions” tab enables users to communicate building information in a highly customized way at a very granular level. Default values do not need to be changed unless the business case is materially impacted by these estimates (i.e. maintenance costs are reducing in addition to energy costs). Most of these assumptions are found in the “Real Estate Characteristics” drop down menu. Use the drop-down menu to change the default escalations rates for general costs and specific fuel costs over time. Sensitivity analyses that explore a variety of future rate scenarios are encouraged to show that you have considered the sensitivity/fragility/resilience of your plan in a variety of futures.
The “Regulatory Assumptions” drop down on this tab includes NYSERDA default values for fuel specific emissions factors stipulated by LL97. This section also automatically calculates the building’s LL97 emissions limits for the 2024-2029 and 2030-2034 time periods using building typology and GSF inputs on the same tab. Please note: As of 2024, the SDA tool has not been updated to reflect any recent changes to LL97 building classes and missions factors.
On the “Equipment Inventory” tab, users will input major energy using equipment. All the fossil fuel equipment and at least 80% of total energy using equipment should be inventoried and reported on this tab. Very similar or identical equipment can be grouped into one row (e.g. multiple AHUs of generally the same size and age). The date of installation is required as it determines the equipment life and is used to define the Business As Usual (BAU) trajectory – existing equipment is projected to continue functioning until it reaches End of Useful Life and is replaced, like for like, at that time. User-input costs for the like for like replacement are also required inputs to complete the BAU trajectory. Please note, the estimated replacement cost and year installed are required inputs for the SDA graphics. Replacement costs for decarbonization measures and BAU equipment replacement need not be overly precise – these cost numbers should be realistic to ensure ROI and NPV calculations are sufficient for comparative purposes.
NPV and savings calculations in the SDA are significantly influenced by major energy using equipment. To streamline SDA development and simplify analysis, project teams should focus on major equipment and group minor equipment together by age, if feasible. If you are not using the landlord/tenant cost/benefit breakout, keep all equipment in column I (Tenants Own/Operate) marked “No”. This tab also enables a simple summer/winter peak/off peak calculator for demand ECMs, but using this feature is optional and is not a replacement for a full 8760 hour model.
The “Percent energy/carbon by equipment RUL” graphics to the right (cell AY) should populate as expected if everything is input correctly. This visual is often used in business case narratives, but does not appear on the Summary tab.
On the “Narrative & Measures” tab, users narratively define their alternatives and input all the ECMs (costs and energy/carbon impacts) that will be assigned to years on the “Alternatives” tab. The SDA automatically generates two BAU cases: one in which LL97 compliance is not sought and fines are applied, and one in which LL97 compliance is achieved through carbon offsets alone.
Note the measure life column is a critical input as it determines how long the measure’s savings will persist – if the measure ends without replacement, the corresponding uptick in energy/carbon on that year will show in the trajectory graphs.
Some potential users may be generating detailed energy models and bringing the outputs from those models into the SDA. These users may streamline ECMs to minimize data entry and rely on the narrative explanation of the measures. The simplest ECM list in this case may be “Year 1 ECMs”, “Year 2 ECMs”, etc. with corresponding costs and benefits; but be advised that users must explain their measures very clearly where they have aggregated costs and benefits.
On the “Alternatives” tab, users schedule ECMs and review the bar charts and trajectories between those Alternatives. The charts on this tab should illustrate the business case consistent with the narrative section. As stated before, the landlord vs. tenant breakdown for ECMs is not required (column H of Alternatives) and the subsequent charts can be disregarded if not used. Note the Holding period and Analysis periods can be varied independently, but most EBC users keep both set for 20 years.
The “Total Relative NPV Compared to Baseline – Varying Time Horizons” chart (cell AZ) is very commonly used in internal business cases to evaluate cost-effectiveness of the Alternatives over different time horizons, but it is not included on the Summary tab.
Most of the calculations happen on the “Operating Statements” tab, where an annual operating statement is created for each alternative/baseline for the 20-year analysis period. Users can review these statements as needed; however, it is not recommended to edit this portion of the tool directly. This is typically done when troubleshooting a trajectory chart that does not match user expectations.
Download
The SDA tool is available for download below, including a blank version as well as a version with data from a sample building.
A baseline assessment is key to understanding current systems and performance, then identifying conditions, requirements or events that will trigger a decarbonization effort. The assessment looks across technical systems, asset strategy and sectoral factors.
Building System Conditions
Asset Conditions
Market Conditions
Step 2
Step 2: Design Resource Efficient Solutions
Effective engineering integrates measures for reducing energy load, recovering wasted heat, and moving towards partial or full electrification. This increases operational efficiencies, optimizes energy peaks, and avoids oversized heating systems, thus alleviating space constraints and minimizing the cost of retrofits to decarbonize the building over time.
Step 3
Step 3: Build the Business Case
Making a business case for strategic decarbonization requires thinking beyond a traditional energy audit approach or simple payback analysis. It assesses business-as-usual costs and risks against the costs and added value of phased decarbonization investments in the long-term.
Decarbonization Costs
Business-as-Usual Costs
Business-as-Usual Risks
Decarbonization Value
Net Present Value
Strategic Decarbonization Action Plan
An emissions decarbonization roadmap helps building owners visualize their future emissions reductions by outlining the CO2 reductions from selected energy conservation measures. This roadmap is designed with a phased approach, considering a 20- or 30-year timeline, and incorporates the evolving benefits of grid decarbonization, ensuring a comprehensive view of long-term environmental impact.
Project Team
Additional Resources
Tags
Insights from Empire Building Challenge
The discovery phase is intended to provide an initial understanding of the building’s existing conditions, current challenges, and potential opportunities. The data and insights gathered during this phase will be used to create the building’s calibrated energy model. Key activities in this workstream include:
Collecting and reviewing relevant building information
Observing building operations under different conditions
Testing subsystems and their interactions
Creating the Business-as-Usual (BAU) base case
This workstream is critical because it grounds the project team in the reality of the building’s current performance. It also helps build a jointly owned process for uncovering early energy or carbon reduction opportunities that can increase trust and enthusiasm to identify more complex measures as the project progresses.
At the end of this phase, the team should have a clear understanding of the building energy systems, its historical energy and carbon profile, the potential impact of local laws or other building requirements, opportunities for additional metering, and preliminary energy and carbon reduction opportunities.
This workstream provides vital information on current challenges, near and longer-term carbon reduction opportunities, and the accuracy of the energy model. It also creates early wins that build momentum and trust. Getting the most out of this work requires trust-based collaboration between multiple stakeholders, including facilities managers, operations staff, the energy modeler, external contractors, and design engineers. Engaging with tenants to get insight into what drives their loads can also add value and inform this process. Data and insights on the building’s existing condition typically arise from four sources:
Design documents
Data from metered systems
Direct observation and testing
Building operations team feedback
Each source is important, but it is the integration across these four categories of data that leads to deep operational insights and identification of major areas of opportunity.
Inputs
Cross-disciplinary, trust-based collaboration
Tenant insights
Activities
Gather Information: In this phase, project teams should work with the building management and operations teams to collect key information using the sample checklist shown below.
Architectural drawings will be used to build the energy model geometry and assign performance characteristics to exterior wall assemblies.
Mechanical, Electrical and Plumbing Drawings: · Mechanical Schedules · Mechanical Riser Diagrams · M-Drawings (Schedules) of Retrofit/Upgraded Equipment or a Description of Changes · Electrical Schedules · Electrical Riser Diagrams · Lighting Schedules and Detail Sheets · Plumbing Schedules · Plumbing Riser Diagrams
MEP drawings will be used to build the energy-consuming systems in the energy model. These documents will also inform opportunities for equipment replacements based on end of useful life and can be referenced when evaluating equipment locations and available space.
Utility Data: · Minimum 12 months of data for all incoming utilities including electricity, natural gas, district steam, fuel oil · Data from tenant electrical sub-meters (if available) · Data from central plant BTU meters (if available)
Building utility bills showing annual energy consumption and tariffs are required to create an initial energy model. Utility bills allow the energy modeler to calibrate the total energy consumption and the breakdown by fuel type, which is important to track as different fuel sources have different greenhouse gas emissions and associated energy costs.
BMS Operational Information: · Fan run hours · Damper and valve positions · Air and water flow rates · Air handling unit supply air set points · Space temperature set points · Air, water and space temperatures · Chiller/cooling tower/boiler entering and leaving water temperatures · Pump flows during peak and off-peak times · Fan and pump electrical consumption and demand data from VFDs
Relevant BMS parameters include: · Meter data · Equipment hours of operation · Temperature setpoints · Data trends · Fault detection · System mode (manual versus override)
Historical data from the BMS can help align modeled energy use breakdowns with actual operation. Collating and reviewing this data can provide insights into building operations. Sometimes building operation differs from the document design, standards, and even the facilities team’s own understanding as system modifications are made incrementally over the years. Live data can be used to verify system schedules, turndown, and setpoints and drive even more accurate modeling of building operations. Building management systems provide insight into how the building is performing in real-time.
Operator Interviews
Information gathered from building operators can provide deep operation insights, serve to develop trust, and identify areas of opportunity for improvement.
Existing Capital Plans
It is also important to gather data on the “business as usual” (BAU) plan for future capital and operational expenditures. Doing so allows the team to compare ECMs against already planned expenditures and to begin to understand the sequence and timing of ECMs within the context of already-planned building upgrades.
Lease Turnover Schedules
Having insight into lease turnover schedules can help define opportunities for engaging tenants in the low carbon retrofit process and identifying proper phasing of decarbonization solutions in tenant spaces.
Survey the Building: Understanding a building’s existing conditions requires time on-site. Design drawings, operator interviews, and utility data all provide valuable insight, but do not capture the nuances of how the building runs day-in and day-out. Project teams should plan to conduct an initial site walkthrough to confirm high-level information about the building equipment, systems, and operations strategies shortly after project kickoff. As the study unfolds, additional site visits to verify information, gain additional clarity on certain conditions, or evaluate the feasibility of implementing ECMs will be necessary. The more time the project team spends in the building, the easier it will be to capture the building’s existing conditions in the building energy model and to develop ECMs that are feasible. When completing the building walkthrough, the project team should evaluate the following:
Space temperatures: does the space temperature feel too low or too high?
Infiltration conditions: are there noticeable drafts within the space?
Pipe trim and valving: is there proper instrumentation within the system?
Unoccupied space conditions: is equipment running when it should be off?
Central plant operations: is equipment running more often than it needs to be?
Piping/duct conditions: are there noticeable leaks or inefficiencies within the distribution?
Multiple controls for different equipment within a single space or physically grouped thermostats: is it possible that the controls are causing conflicting operation?
Deploy Additional Metering (if required): Collecting documentation and surveying the building will highlight gaps in data or information needed to build a calibrated energy model. To fill these gaps, the project team may elect to deploy additional metering to capture the missing information. Metering ultimately reduces speculation and provides real-time insight into the building’s operations. Project teams should execute the following steps when developing a metering strategy:
Identify and create an inventory of existing meters, submeters and instrumentation.
Verify the accuracy of existing meters and ensure they are properly connected and integrated in the building management system (BMS).
Gain direct access to view the BMS data. Ideally, the team will have viewing access to real-time building operations during the entire duration of the project.
Identify areas where additional meters will be required.
Develop a deployment program for additional metering needs including preferred vendors, meter types, meter quantities, locations for placement, and an installation schedule.
Observe and Test Systems: Building system assessments and functional tests are great ways to capture operating parameters, evaluate performance, and identify issues that can be resolved with retro-commissioning. Project teams should conduct some or all the following building tests to further inform the study:
Test/Assessment
Goals
Reference/Procedure
Building envelope performance and infiltration
Understand the conduction losses/gains through the envelope. This will inform potential envelope opportunities and the baseline energy model.
Refer to ASTM E1186 – 17 for standard practices for air leakage site detection in building envelopes and air barrier systems.
Tenant electric load disaggregation, i.e. plug loads, lighting, IT
Identify high consumption loads within tenant spaces to target critical loads and opportunities.
Select one or two tenants and install submeters on their floor (can be temporary), separating out loads by lighting, IT, plug loads. Analyze consumption and data trends to develop energy conservation measures.
Setpoints and setbacks in all spaces (tenant areas, common area, IT rooms, MEP) during winter and summer seasons
Determine the most energy efficient setpoint/setback while maintaining a comfortable space. Evaluate what is possible within each space. Evaluate the ability of the system to recover from the setback without causing excessive utility demand.
Test potential setpoint and setback temperatures within each space type to determine the optimal energy efficient condition.
Airside controls
Verify that airside controls are configured to optimize energy and indoor air quality. Identify easy-to-implement and inexpensive controls ECMs.
Test procedures will vary based upon the type of airside equipment in use; however, the following assessments are applicable to many airside configurations and can act as a starting point: Step 1: Verify that static pressure setpoint controls are correct per the sequence of operations or current facility requirements. Step 2: Verify that supply air temperature resets are programmed and operating within the correct range. Step 3: Verify that terminal box minimum and maximum setpoint are appropriately set per the latest balancing report. Step 5: Confirm if outdoor airflow stations are installed, and if so, verify that the appropriate amount of outside air is being delivered per the design documents or current facility requirements. Step 6: Verify if a demand control ventilation (DCV) program is in place. If so, confirm that outside airflows are reduced as occupancy is reduced. Step 7: Verify that turndown controls are appropriately reducing equipment temperatures or flows in low load conditions.
Waterside controls
Verify that waterside controls are configured to optimize energy and are load-dependent.
Identify easy-to-implement and inexpensive controls ECMs.
Test procedures will vary based upon the type of waterside equipment in use; however, the following assessments are applicable to many waterside configurations and can act as a starting point: Step 1: Verify that static pressure setpoint controls are correct per the sequence of operations or current facility requirements. Step 2: Verify that supply or return temperature resets are programmed and operating within the correct range. Step 3: Confirm if an economizer mode is available, and if so, verify that the system appropriately enables this mode in certain weather conditions. Step 4: Verify that turndown controls are appropriately reducing equipment temperatures or flows in low load conditions.
BMS anomalies and faults
Identify discrepancies in what the BMS is outputting on the front-end versus the actual observed conditions. Identify easy-to-implement and inexpensive controls ECMs.
For each tested system, compare the BMS outputs to the actual measured data or observed condition. Identify the root cause of the discrepancy and resolve.
Outputs
An additional metering strategy with a timeline for installation and a plan for measurement & verification of new meters.
A preliminary list of operational adjustments and retro-commissioning issues based upon building surveys and building system assessment/tests.
A plan for implementing operational opportunities like setbacks and setpoint adjustments.
Lessons Learned and Key Considerations
Investigation and discovery are an iterative process: — Information from all avenues including reviewing design drawings, walking the building, talking to the facilities team, and performing building tests will be required to create a full picture of the building’s existing condition. Consistent feedback is the key to success.
Organization should be a top priority: — The amount of information collected on the building will be significant. To ease the burden of developing an energy model for the building, information should be verified and organized so that it can be easily referenced throughout the project.
Business operations are as important as facility operations: Energy studies tend to focus only on the architectural and MEP operations within the building. Project teams spend a lot of time understanding how equipment and systems operate and perform, but often don’t spend enough time considering the building’s existing lease turnover schedules, existing capital plans, or hold strategy. These business considerations are critical to understanding the types of decarbonization strategies that building ownership are likely to invest in.
2. Build the “Business-as-Usual” Base Case
Building the business-as-usual (BAU) base case occurs between the Discovery and Energy Modeling phases and includes an analysis of the building’s utility data to gain insight into how the building uses energy at a high level and how that consumption translates to carbon emissions. From this analysis, the project team will be able to evaluate the building’s exposure to mandates such as Local Law 97.
Inputs
Building the BAU base case requires obtaining one full year of utility data, at a minimum.
Activities
Utility Analysis (Baseline Condition): As the project team learns the building, one full year of utility data (at a minimum) will be collected. The project team should visualize this data monthly to further develop its understanding of how and when the building uses energy. The following list of questions can be used to guide the analysis:
What fuel types are consumed by the building?
When are fuel types used the most or the least and why?
Are there unexpected usage peaks for certain fuel types?
What is the building Energy Use Intensity (EUI) and how does it compare to peer buildings?
What is the building Energy Cost Intensity (ECI) and how does it compare to buildings?
What service class is the building in and what is the tariff structure for that service class?
How does demand correlate with cost?
Based on the results of this activity, the project team will begin to form hypotheses about how building systems interact, which end uses are the most energy intensive, and where deeper energy and carbon reduction strategies may be pursued.
Building Performance Standard Impact Analysis: Depending on the jurisdiction in which the deep energy retrofit study is taking place, it may be beneficial for the project team to evaluate the building’s current performance against mandates or building performance standards (BPS) that are in effect. In New York City, for example, Local Law 97 is a BPS that many building owners are focused on. Other jurisdictions may have energy use intensity (EUI) targets or other metrics for performance. The outcome of the impact analysis may help to inform the overall decarbonization approach for the building. Project teams should execute the following steps to conduct a BPS impact analysis:
Step 1: Aggregate annual utility data by fuel type.
Step 2: Convert raw data into the appropriate BPS metric. In the example of LL97, annual fuel consumption is converted to annual carbon emissions with carbon coefficients that are published in the law.
Step 3: Compare the building’s annual performance against the BPS performance criteria.
Step 4: Consider how the building’s performance might change over time as the electric grid decarbonizes. In the example of LL97, a building’s carbon emissions associated with electricity consumption will naturally decline over time as the grid decarbonizes.
Step 5: Calculate impacts of compliance or non-compliance with the BPS. For LL97, building emissions in excess of the allowable carbon limit results in an annual financial penalty.
Step 6: Share results with the building management and ownership teams to further inform that building decarbonization approach.
During the energy retrofit process, the team will discover simple ways to reduce energy consumption that can be implemented almost immediately. With real-time data, the BMS allows the team to analyze how effective the changes to the system are.
Outputs
Deliverables for this task include the following:
Energy, carbon & cost end use breakdowns (monthly)
Demand and tariff structure analysis
Mandate or Building Performance Standard impact analysis
Lessons Learned and Key Considerations
Visualize the data: — Data visualizations can bring insights to light and help project teams explain these insights to non-technical audiences. Making complex energy analysis accessible to all members of the project team, including those without technical backgrounds, will lead to a more engaging and actionable process for all.
BPS impact assessments can alter the deep energy retrofit approach: — Mandates and building performance standards are often successful in getting building owners to think more critically about existing building energy and carbon performance; however, the anticipated impact of a BPS can alter how the project team approaches a deep retrofit project. For example, if an Owner discovers that their building is not subject to non-compliance penalties until 2030 or 2035, they may elect to wait on larger retrofit projects than they would have if penalties were imminent in 2024. It’s important that project teams review BPS exposure with the Owner before settling on a particular decarbonization strategy or timeline.
Consider the grid: — When evaluating a building’s anticipated performance over time in the BAU base case, the project team must take grid decarbonization into account. The overall outlook for the building can change drastically with and without grid decarbonization. Both scenarios must be explored and discussed with the building owner and management team.
3. Identify Preliminary ECMs and Carbon Reduction Strategies
Inputs
Based on the work completed during the “Learn the Building” and “Build the BAU Base Case” tasks, the project team should already have a sense of the ECMs that are a good fit for the building. The project team should review the outcomes of the work done up to this point and develop a list of preliminary strategies so the team can level set on an approach as the project enters the Energy & Carbon Modeling phase.
Activities
• Develop a Tiered List of ECMs: Through the document collection and building system assessments, the project team likely identified low or no-cost operational items that can be implemented immediately. These simple items should be grouped and presented as Tier 1 measures. Deeper measures that require more upfront capital and/or have a longer lead time should be separated out into Tier 2 items. Tiers can be based upon cost or timeframe for implementation. Categorizing measures in this way will support building owner decision-making.
• Conduct a Qualitative Assessment of ECMs: Once the measures are appropriately categorized into tiers, the project team should generate a qualitative assessment of each measure, based on metrics that are important to the building management team. For example, one building team may identify disruption to tenants as their primary go/no-go metric when deciding which strategies deserve deeper analysis. Metrics will vary from project to project.
• Present and Solicit Feedback: Present the tiered list of ECMs, along with the qualitative assessment, and solicit feedback from the building management team. Eliminate ideas that don’t meet the team’s decarbonization approach and welcome new items that the building team may want to pursue that were not originally considered. This process will bolster team engagement and ensure that time spent in the energy model is dedicated to measures that will be considered seriously by the building team for implementation.
Outputs
The output of this task will be a finalized list of energy reduction strategies to study the next phase: the Energy & Carbon Modeling Phase.
Lessons Learned and Key Considerations
Solicit feedback early and often: — In any deep energy retrofit study, there will be several opportunities for the building to reduce energy and carbon. Some of these strategies will be reasonable to the building management and ownership teams, and others will not. To avoid going down the wrong road and analyzing a set of solutions that don’t align with the building team’s vision, the project team should present potential strategies early on and gain consensus on the decarbonization approach before analyzing measures in the building energy model.