


This guide from The Clean Fight and RMI helps building owners and managers understand how high-temperature heat pumps can decarbonize steam and hot-water space heating systems. It outlines key benefits, technology basics, example products, and strategies for effective retrofit integration. High-temperature heat pumps offer a new, less disruptive path to electrification for buildings with steam or hot water distribution.
Transformative hybrid electrification retrofit leveraging IRA tax credits
This case study was chosen as part of the Empire Building Challenge competition. Click here to learn more about the Empire Building Challenge competition.
Tags
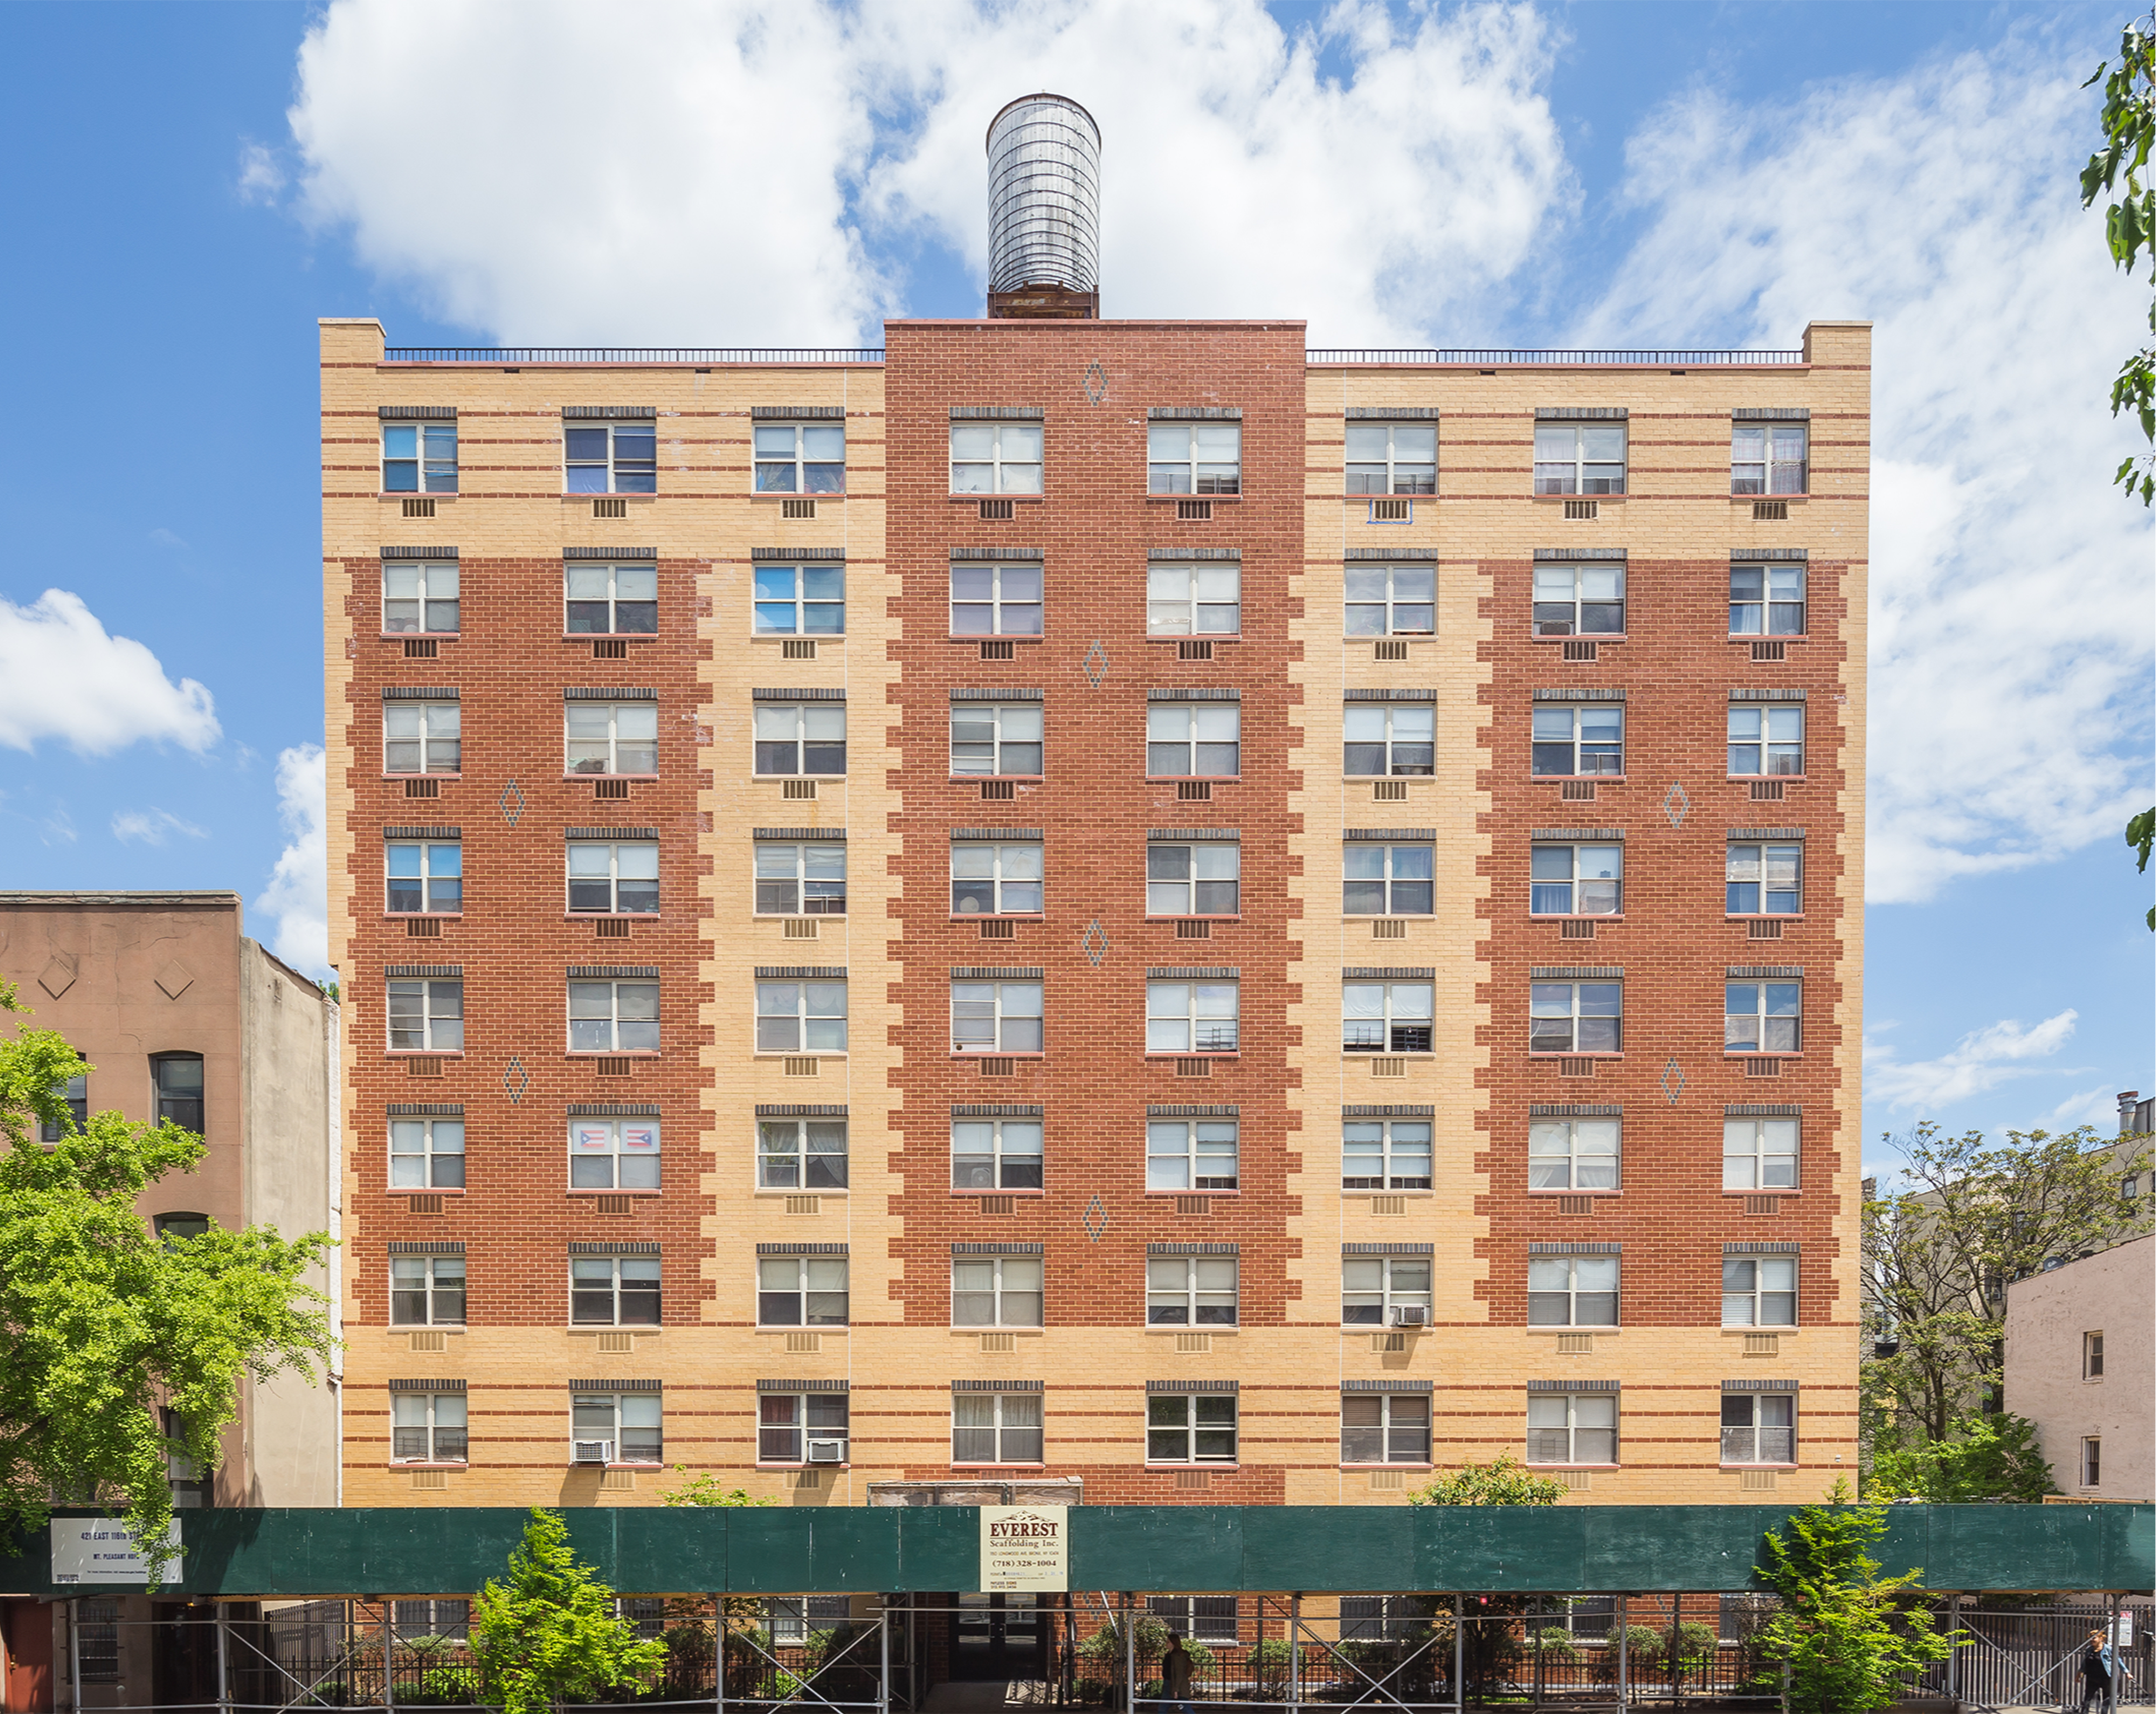
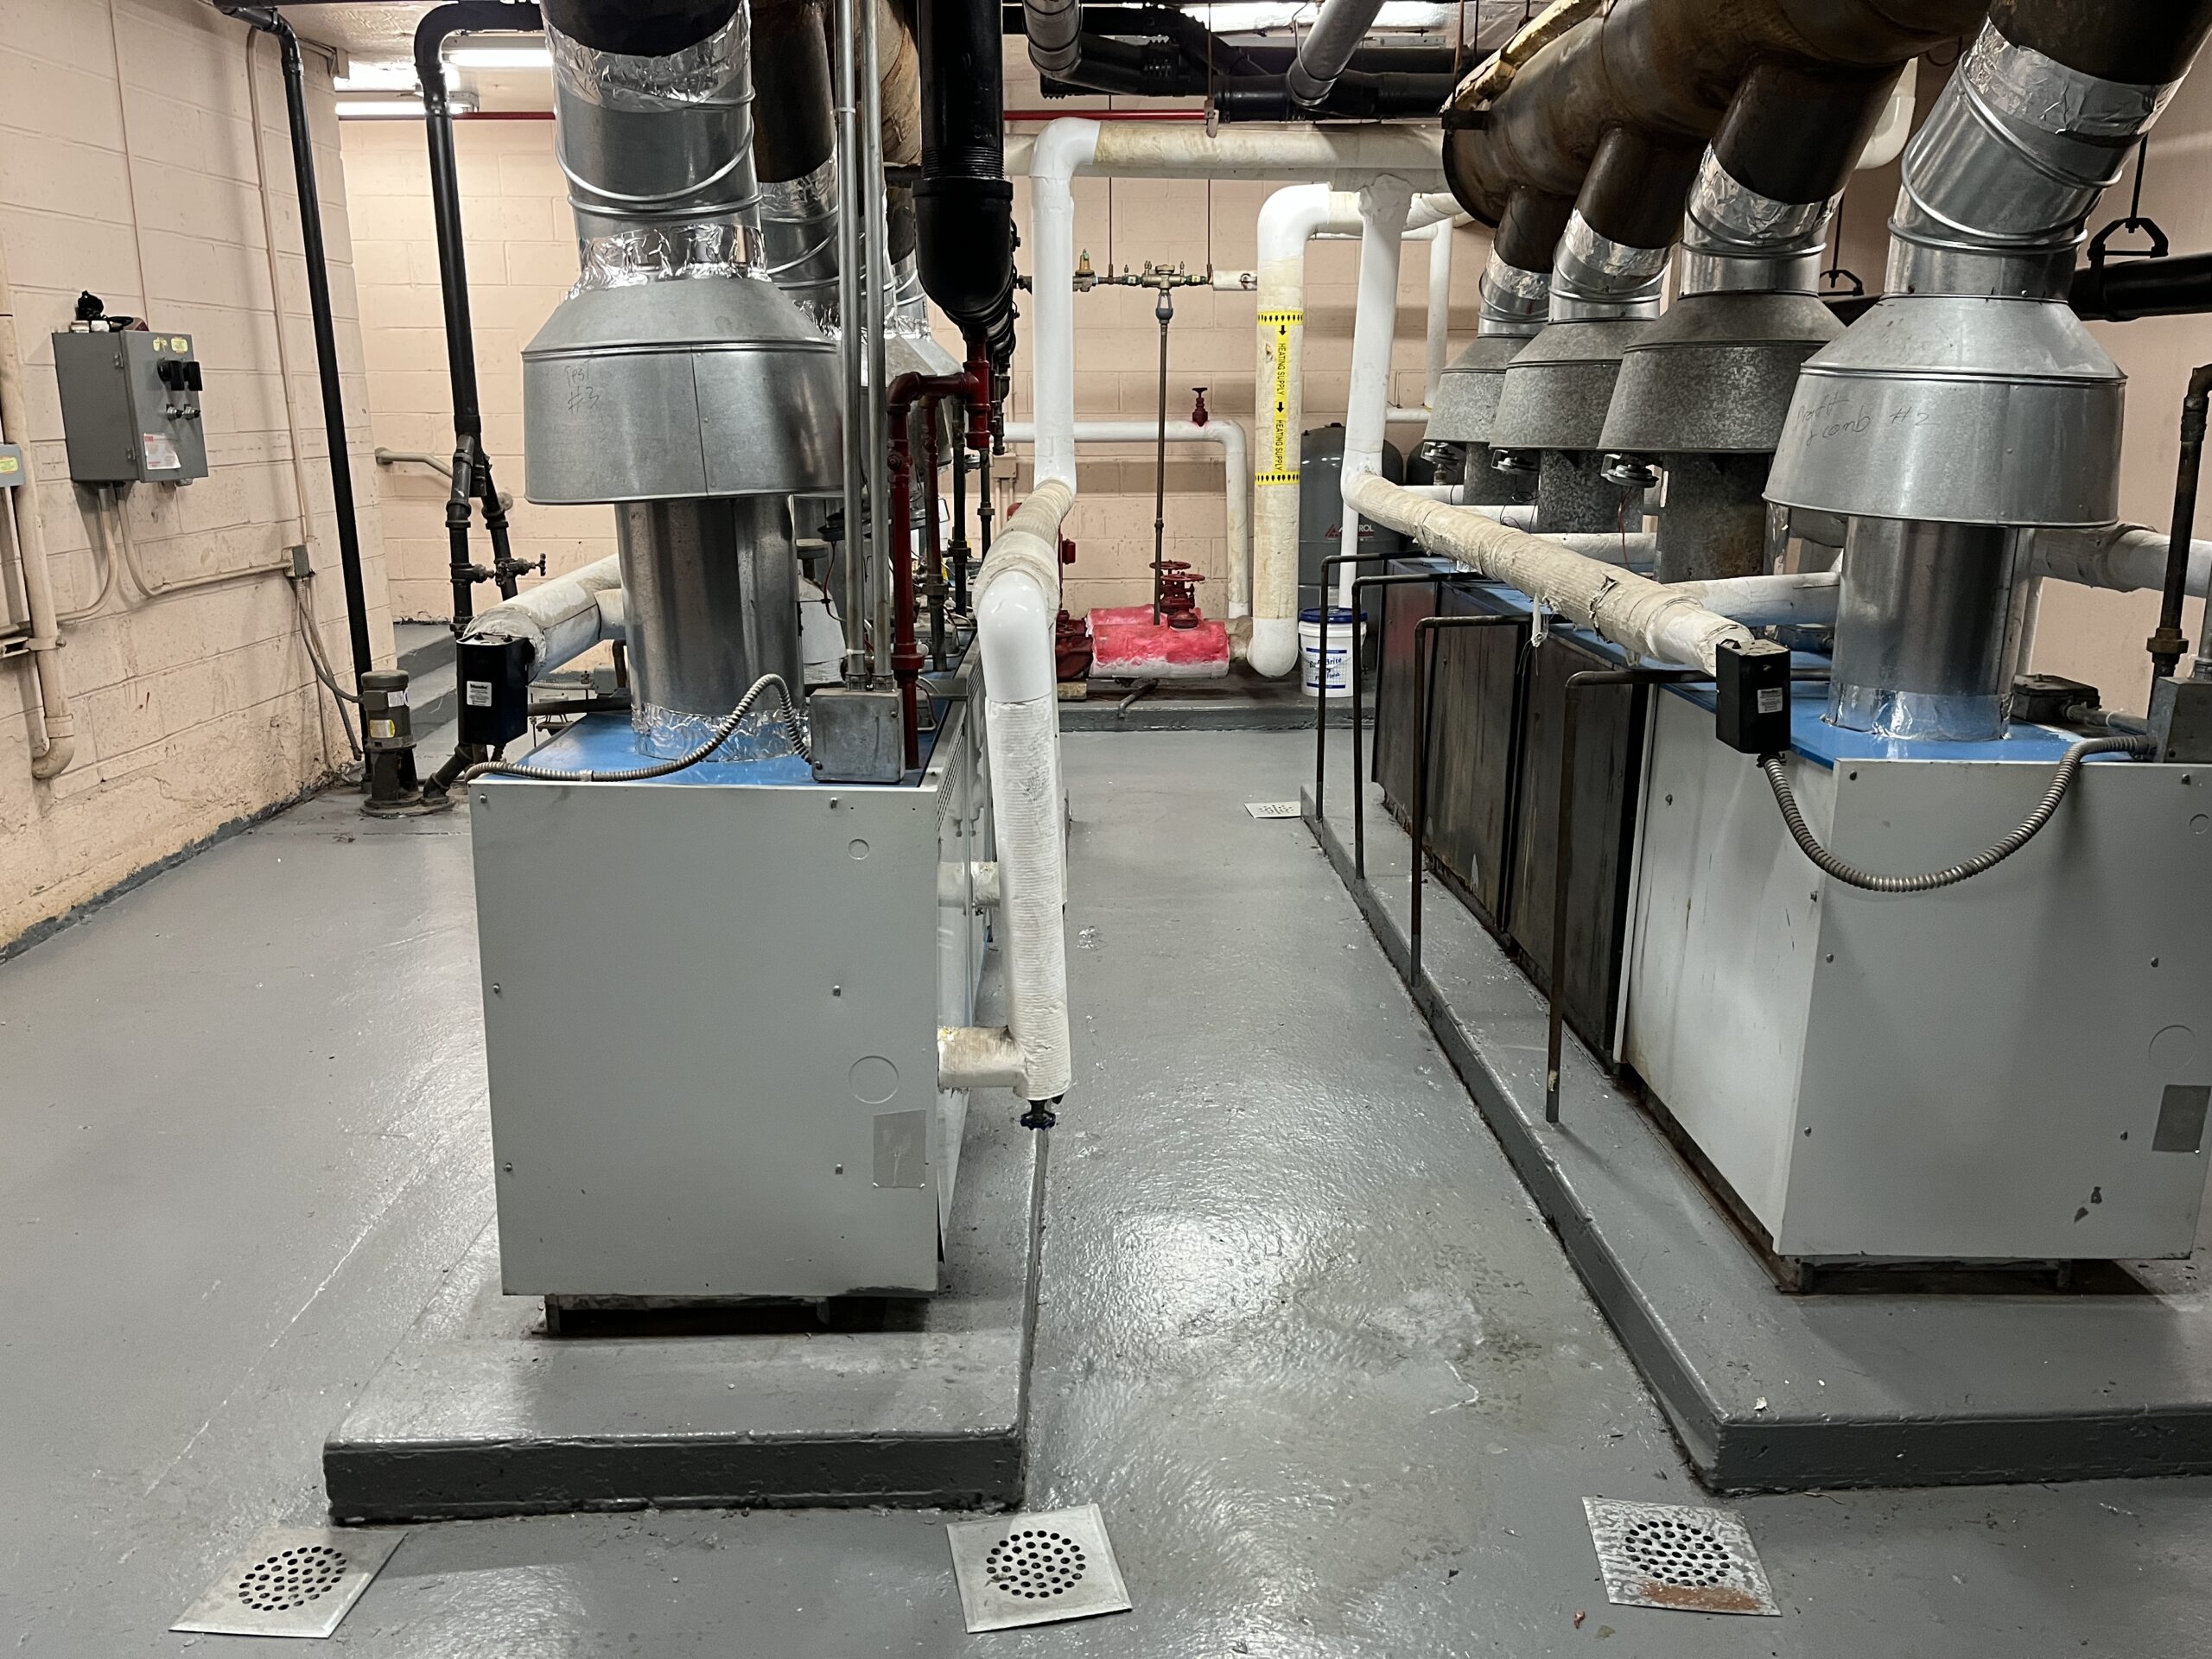
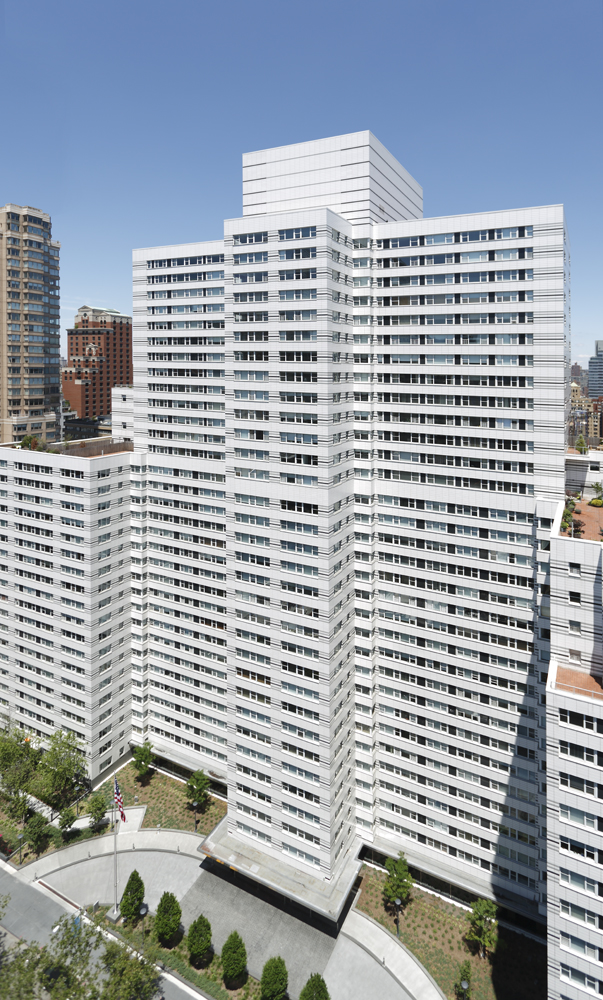
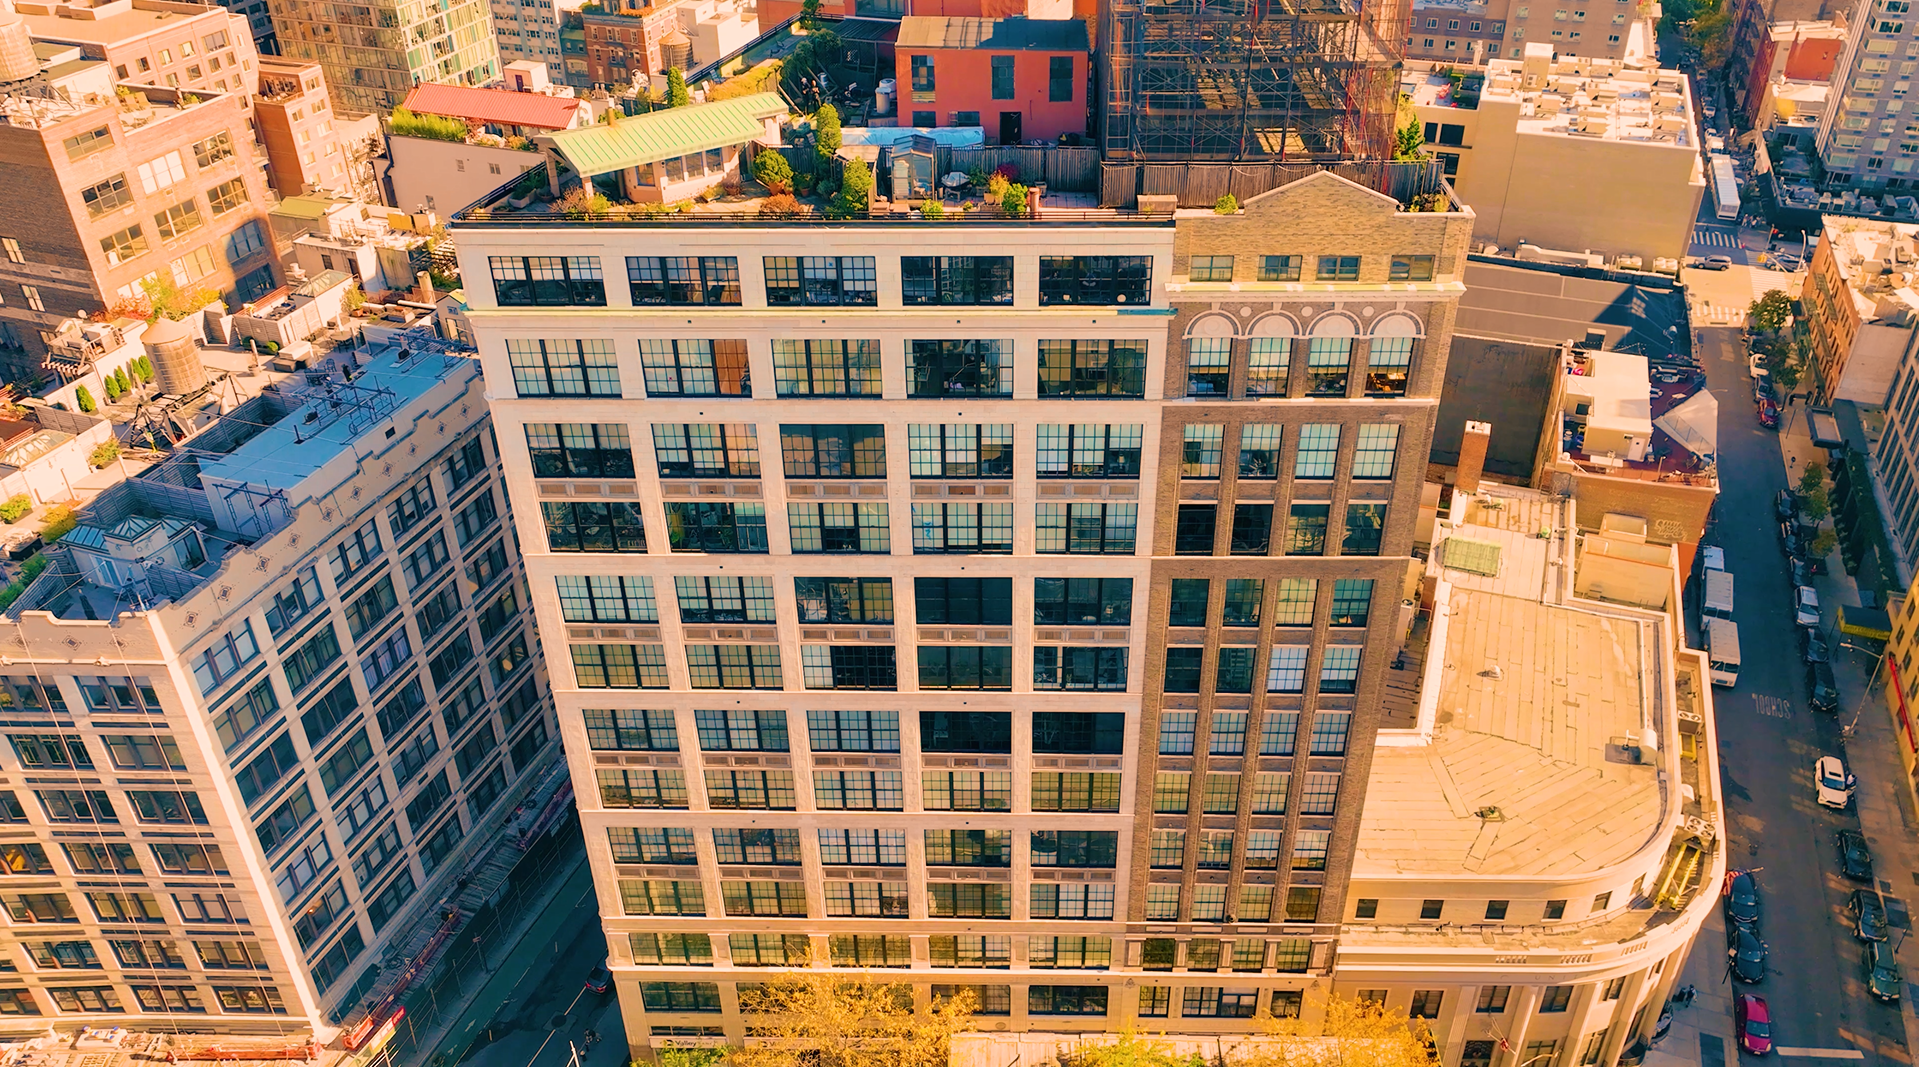
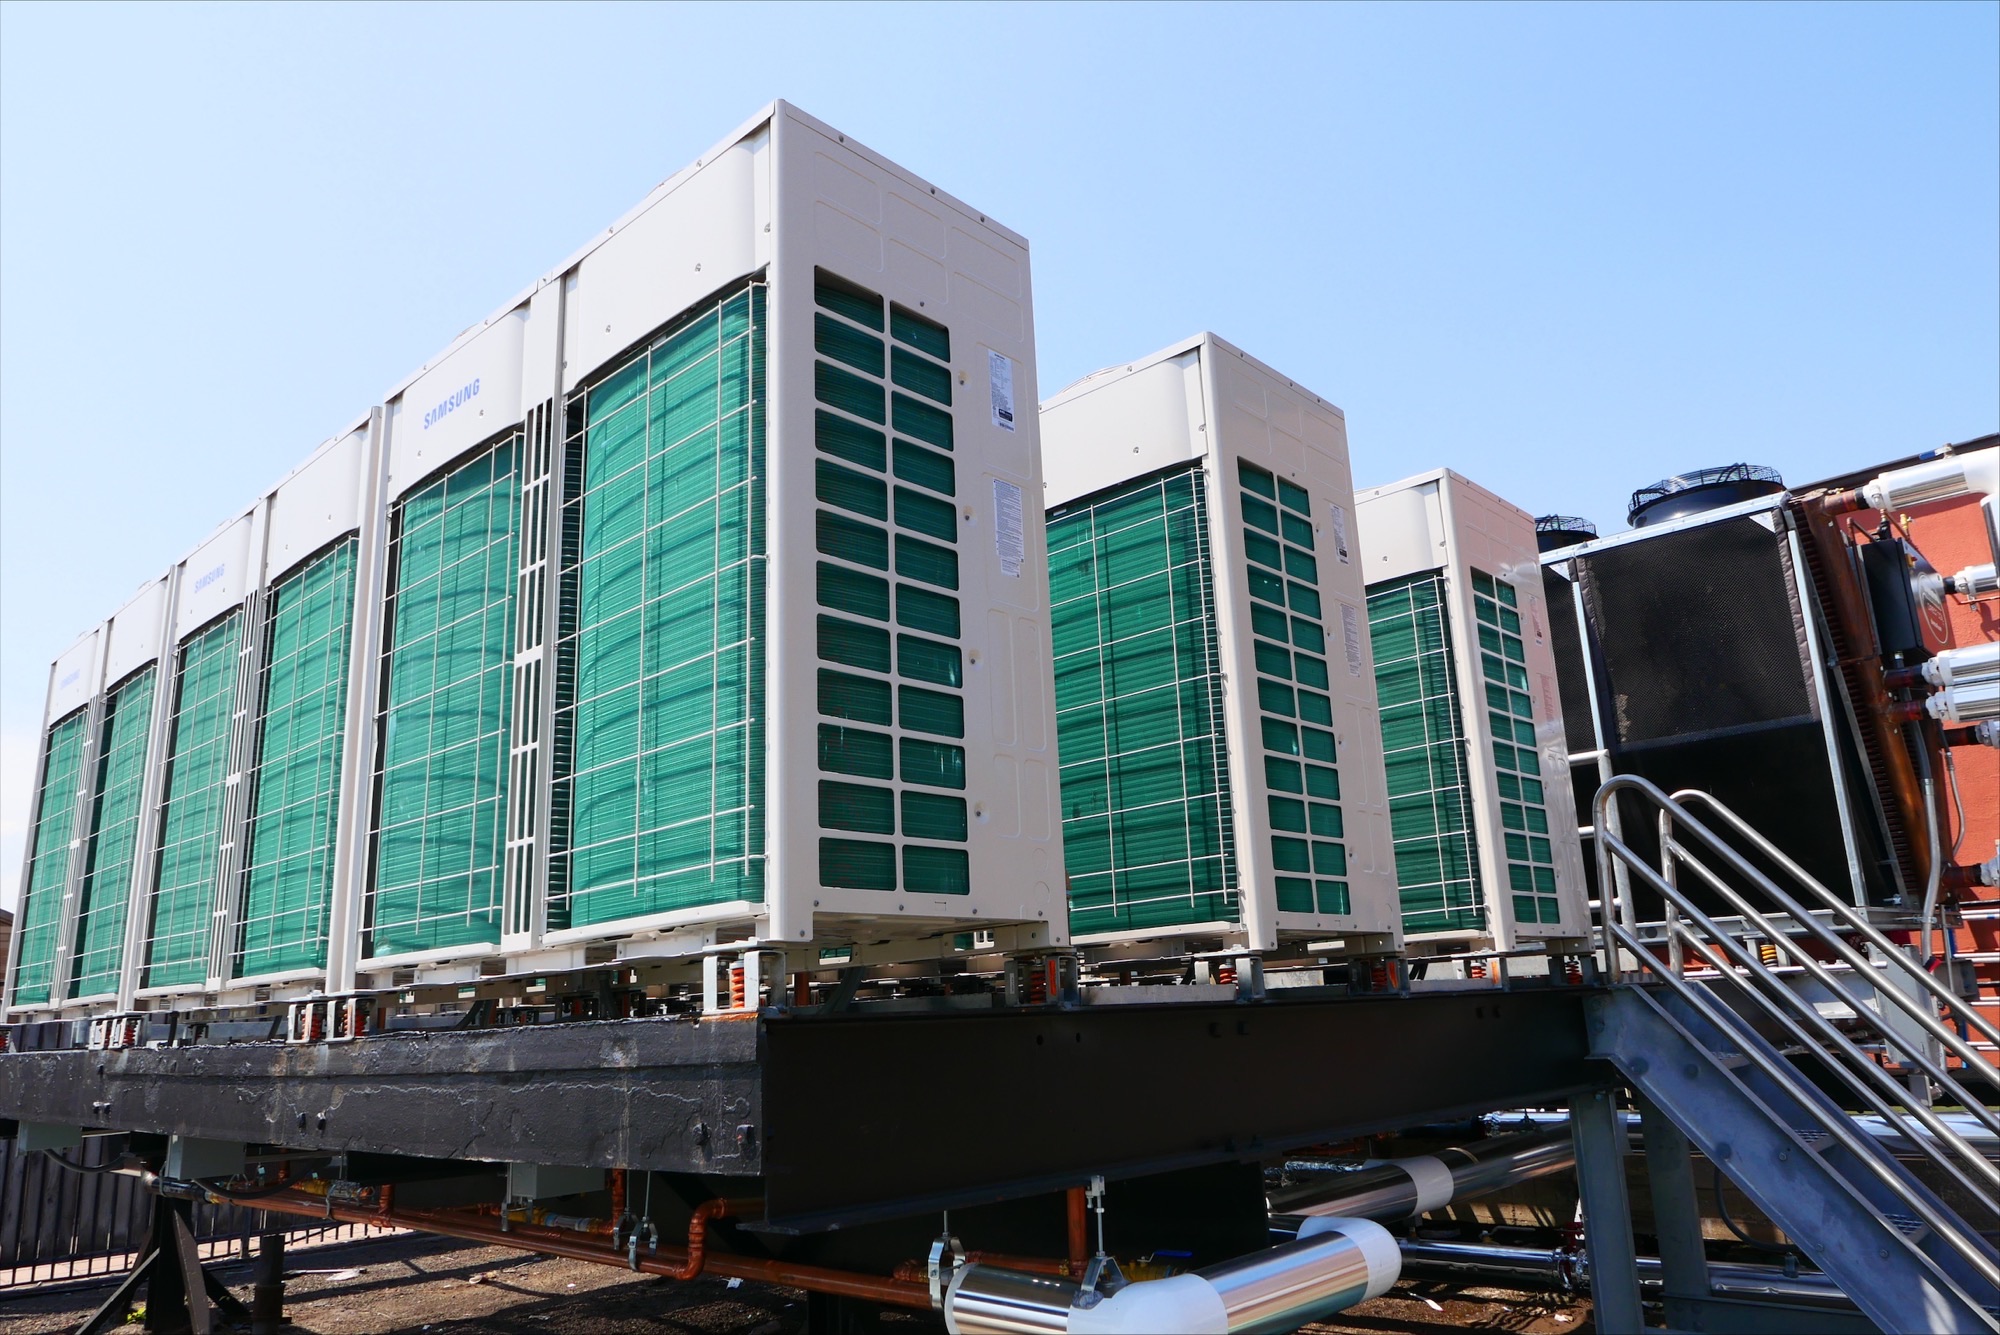
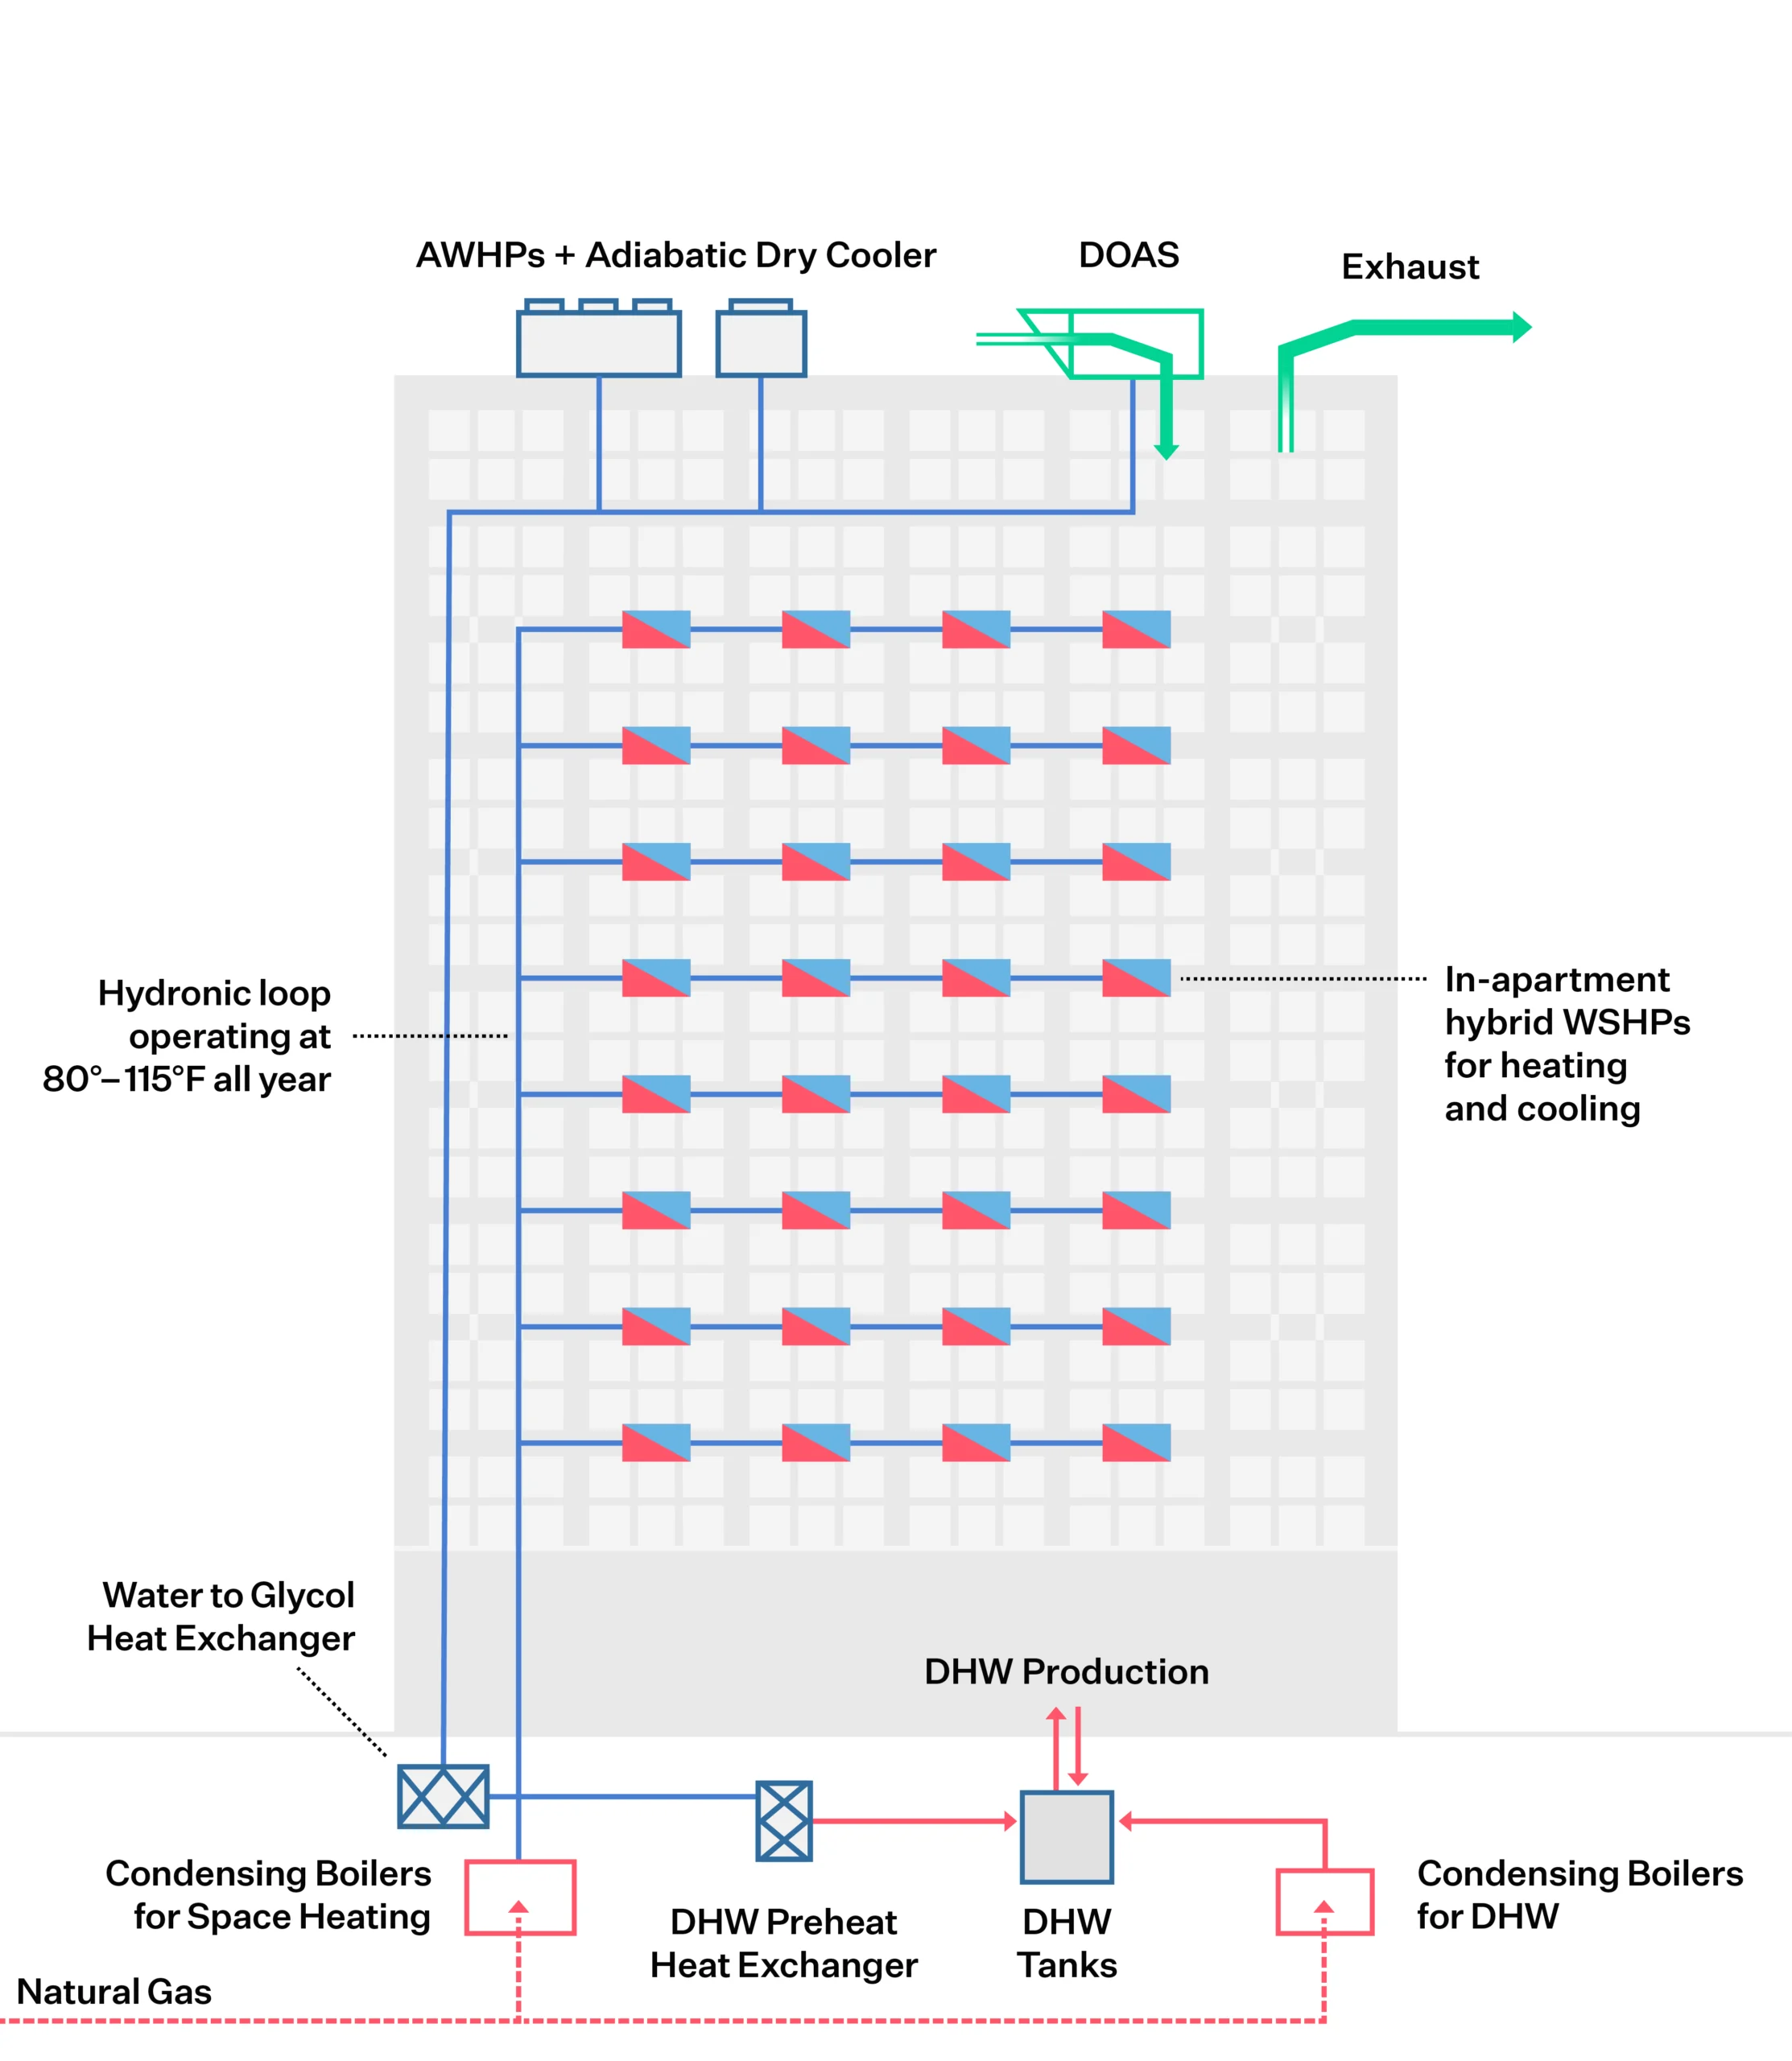
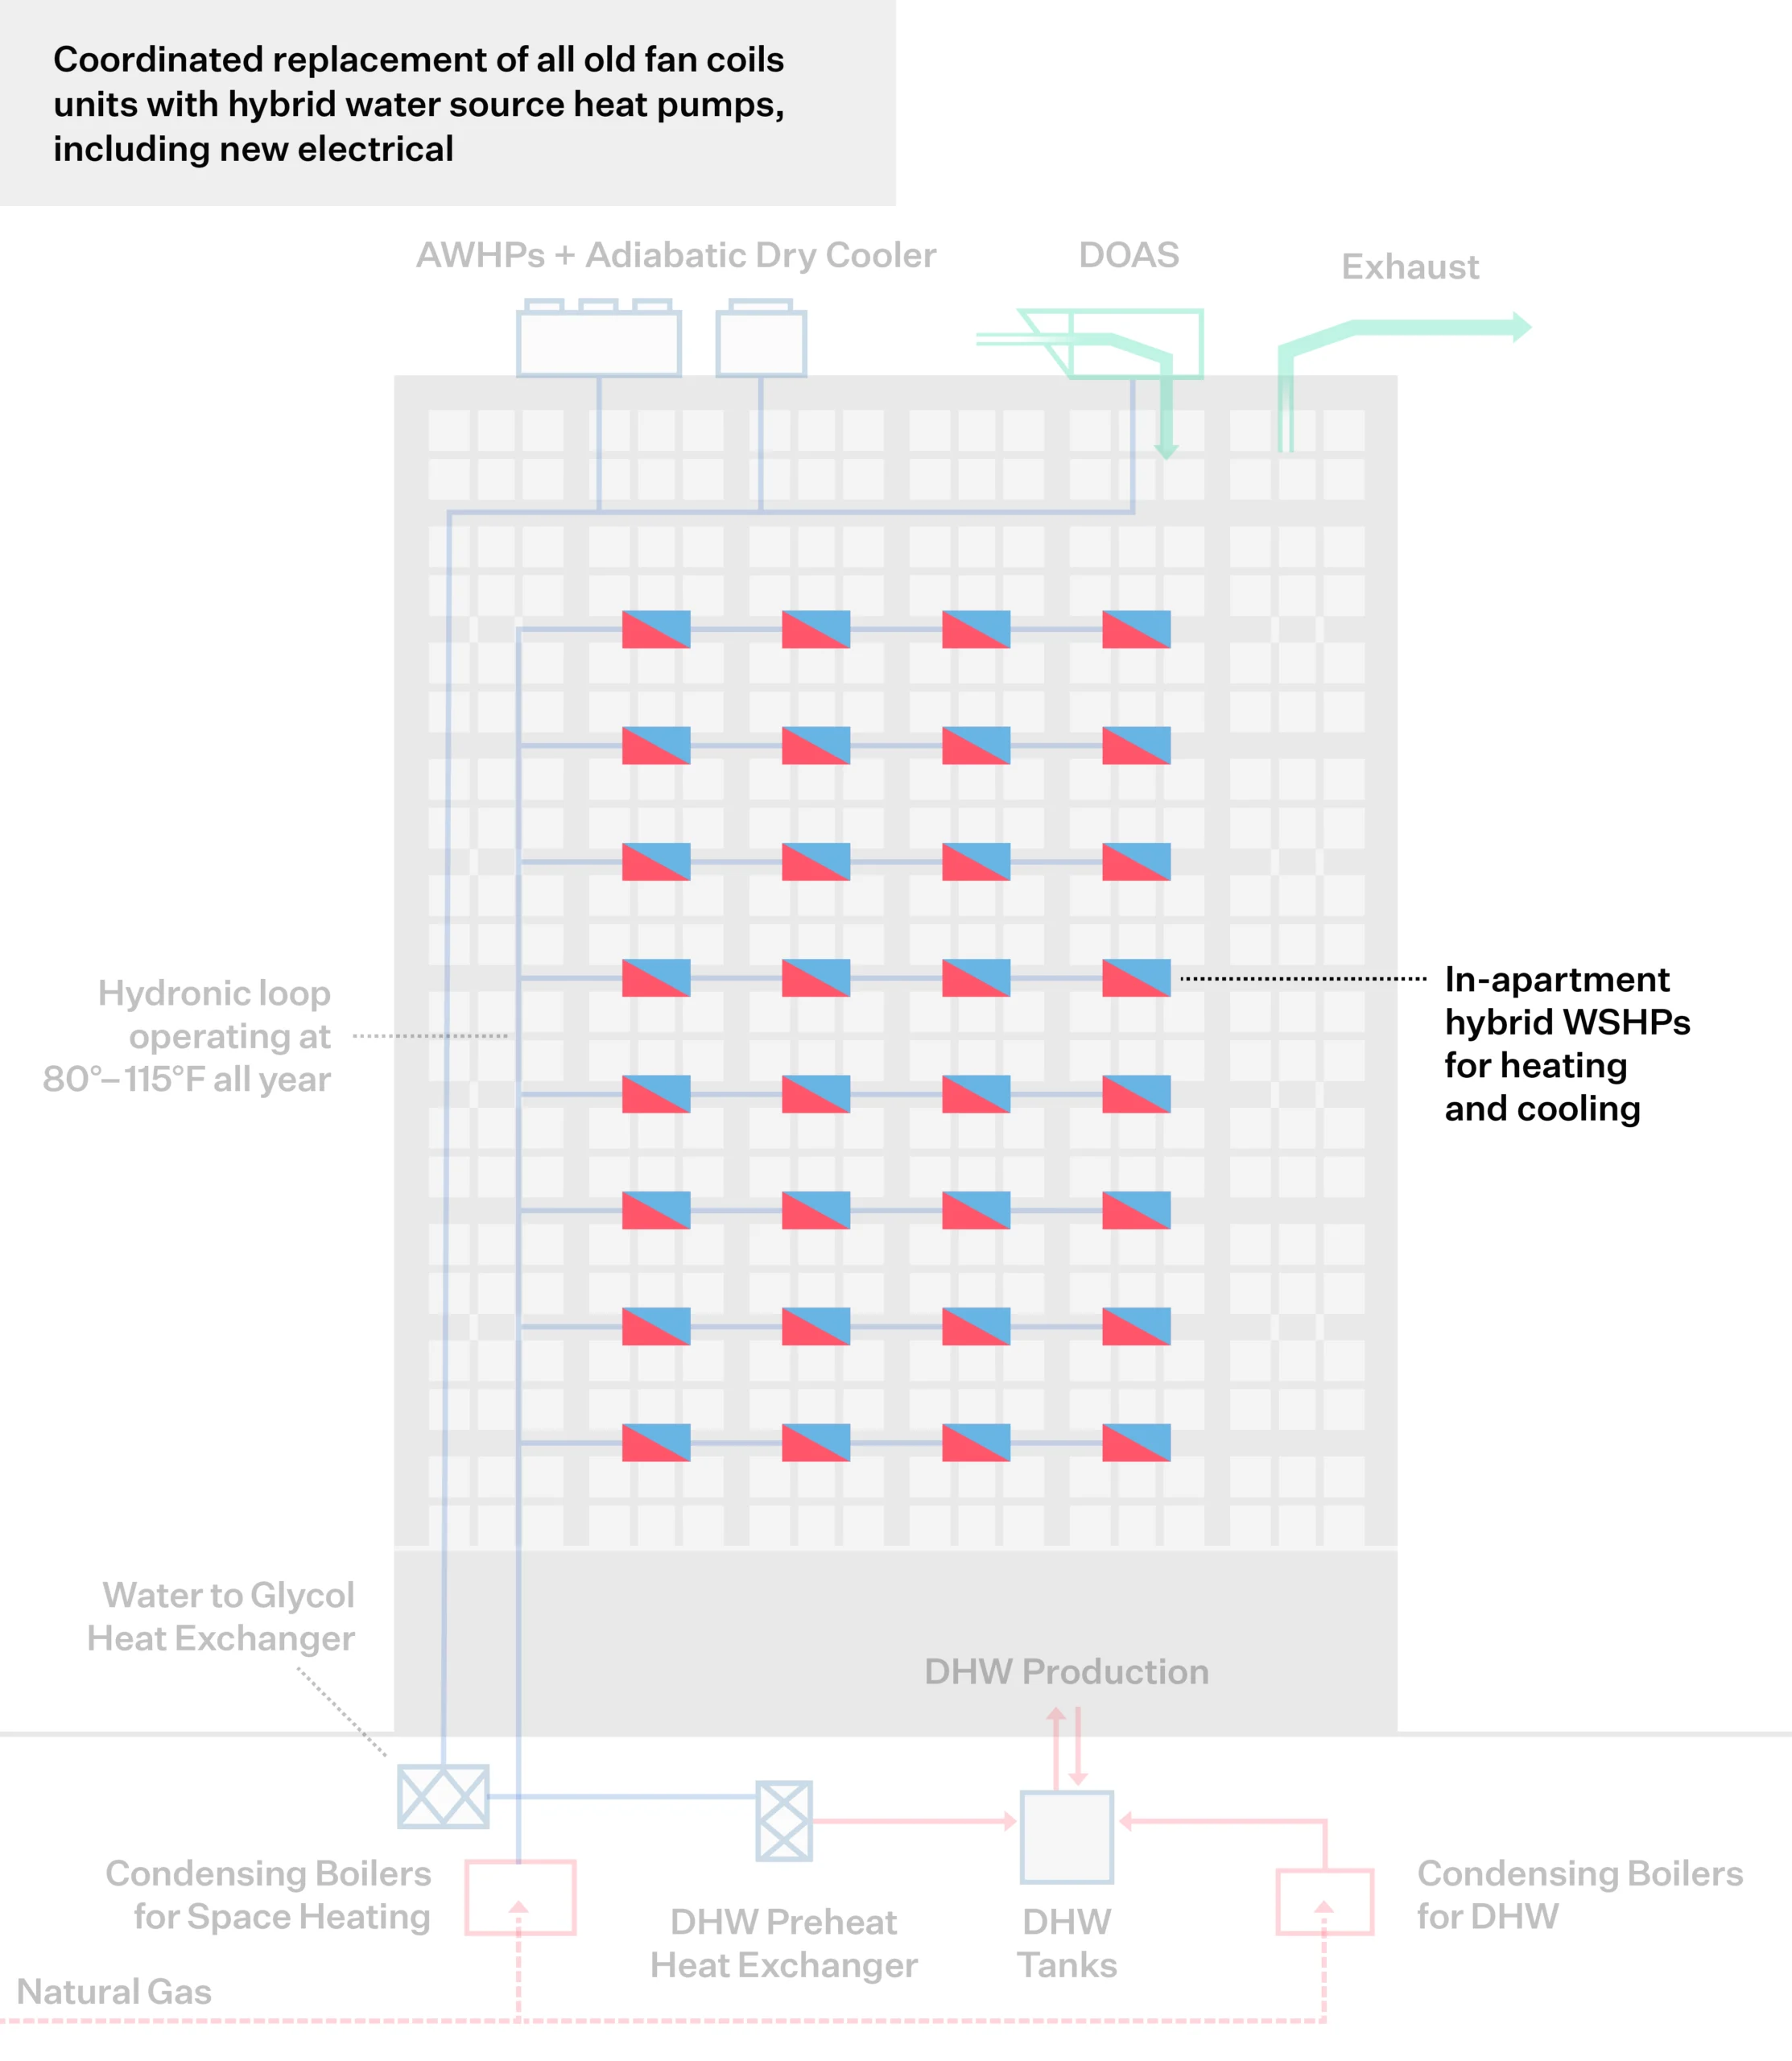
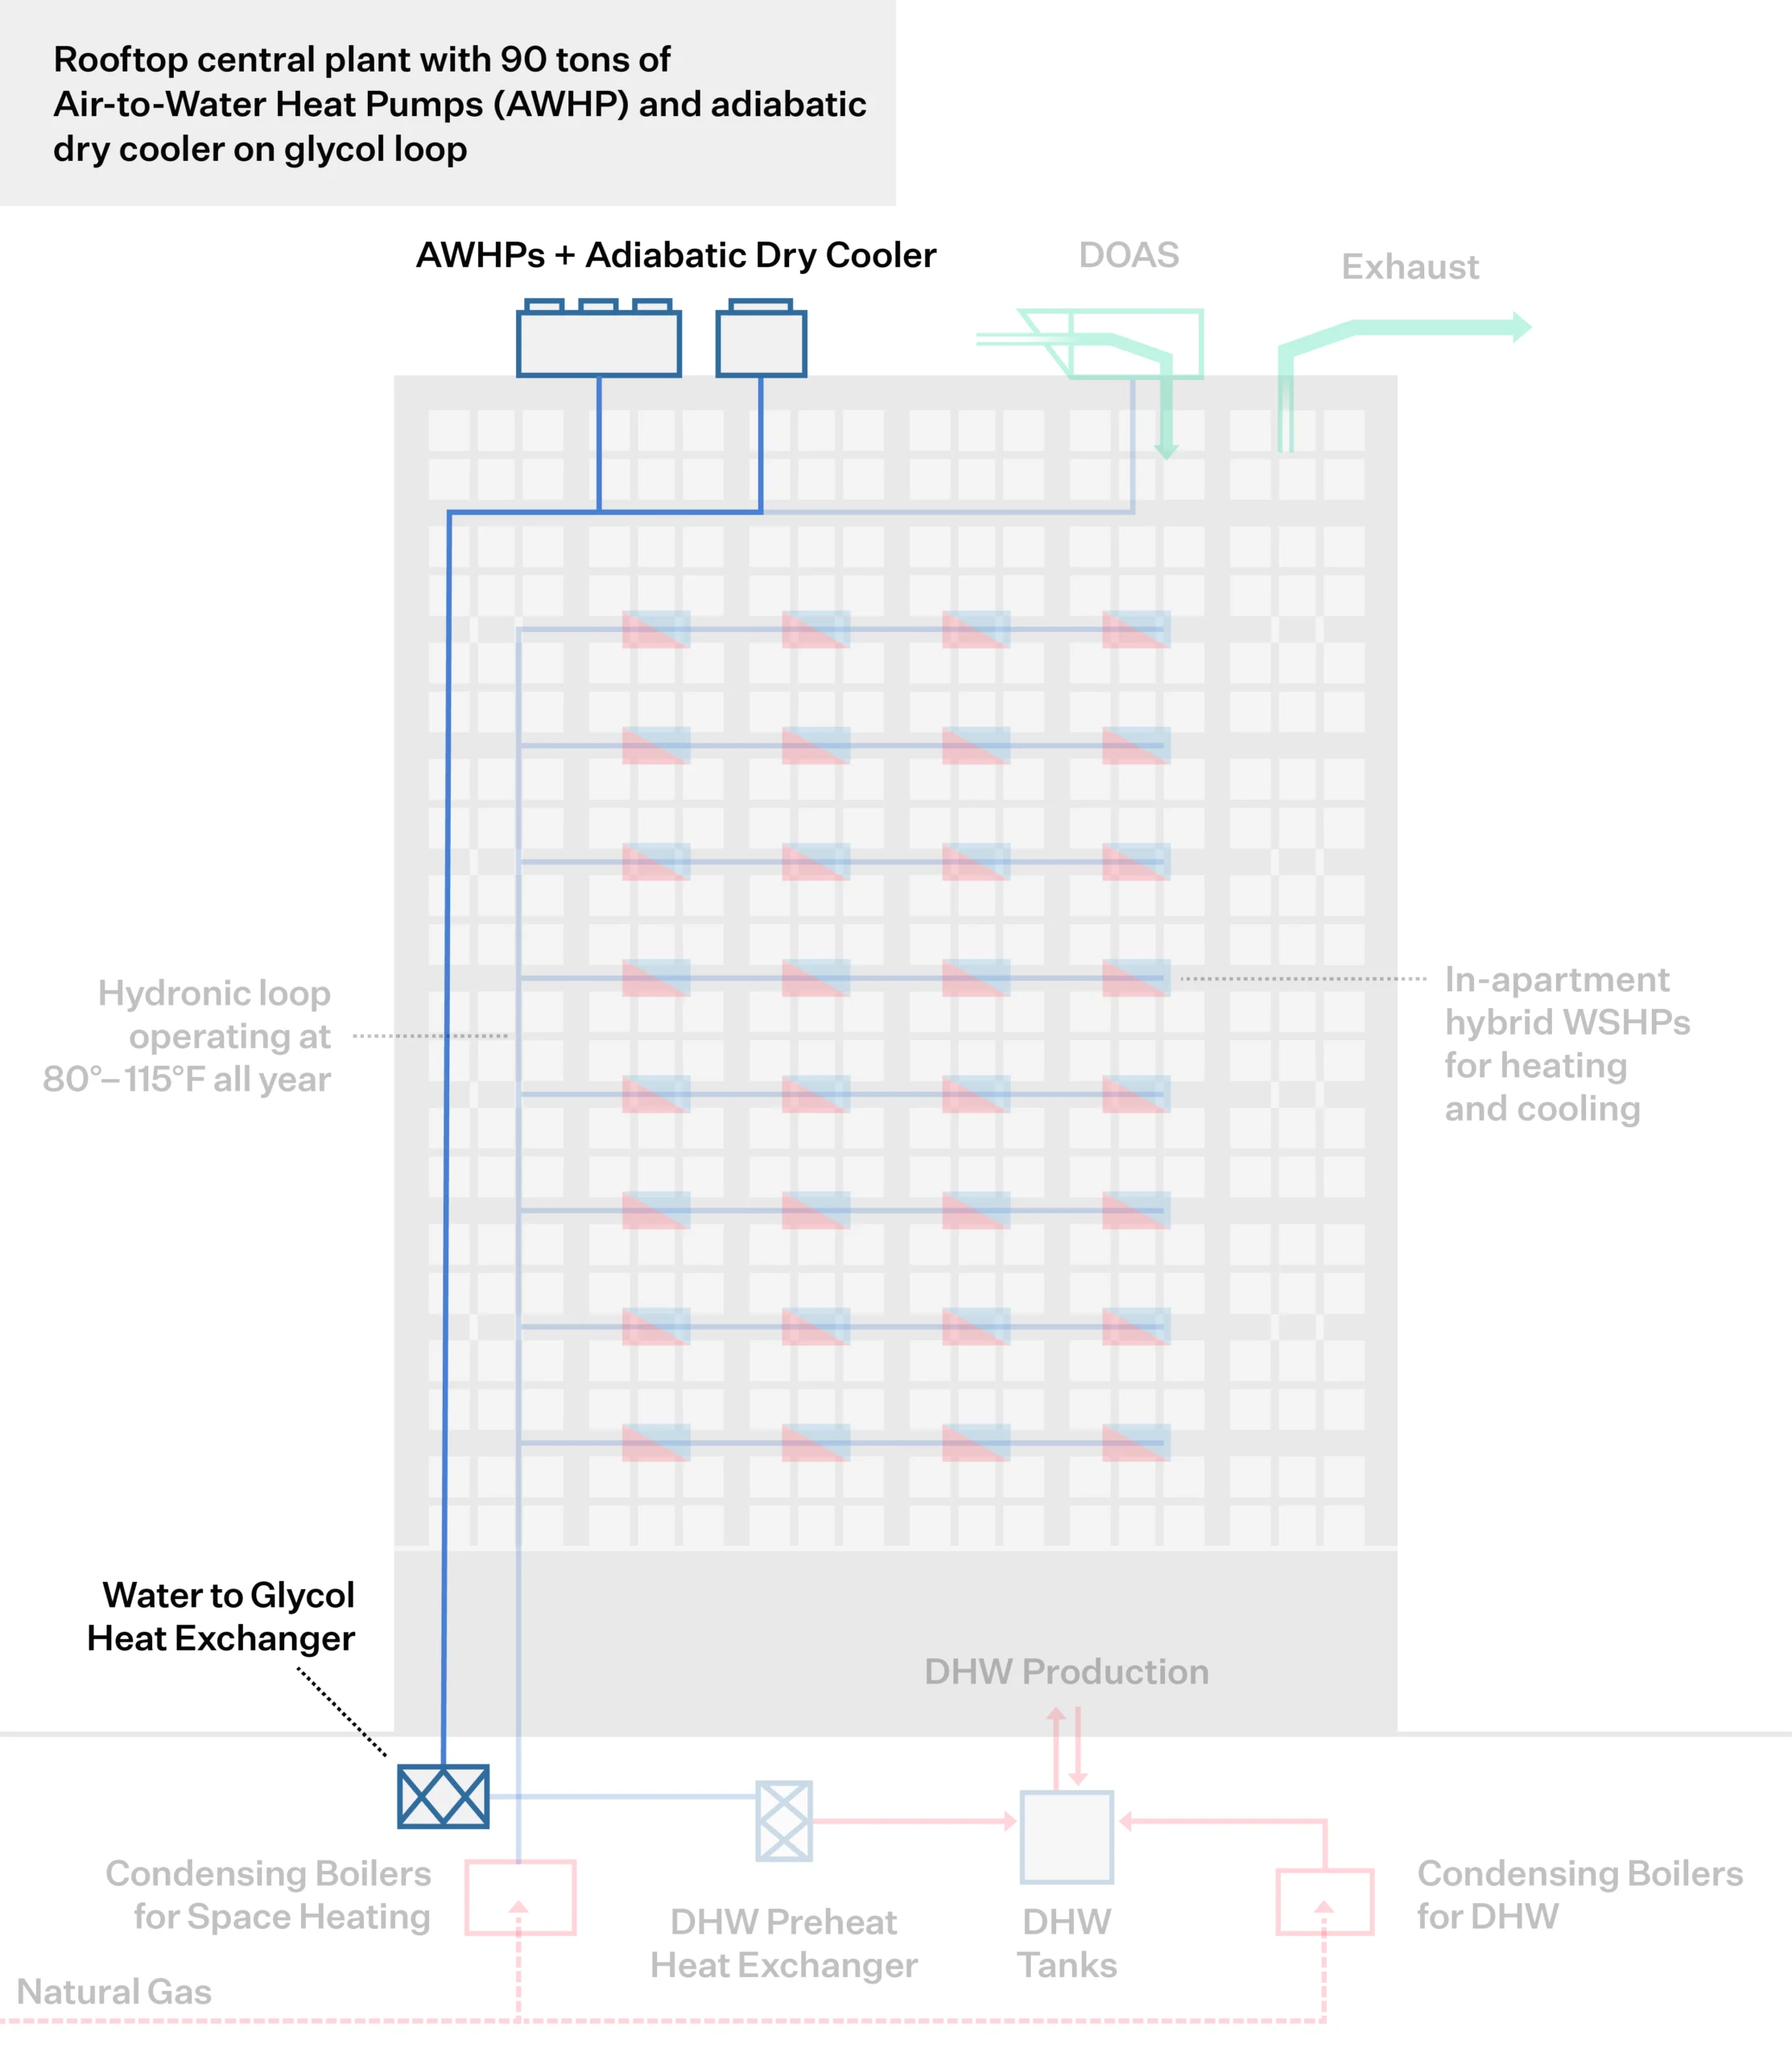
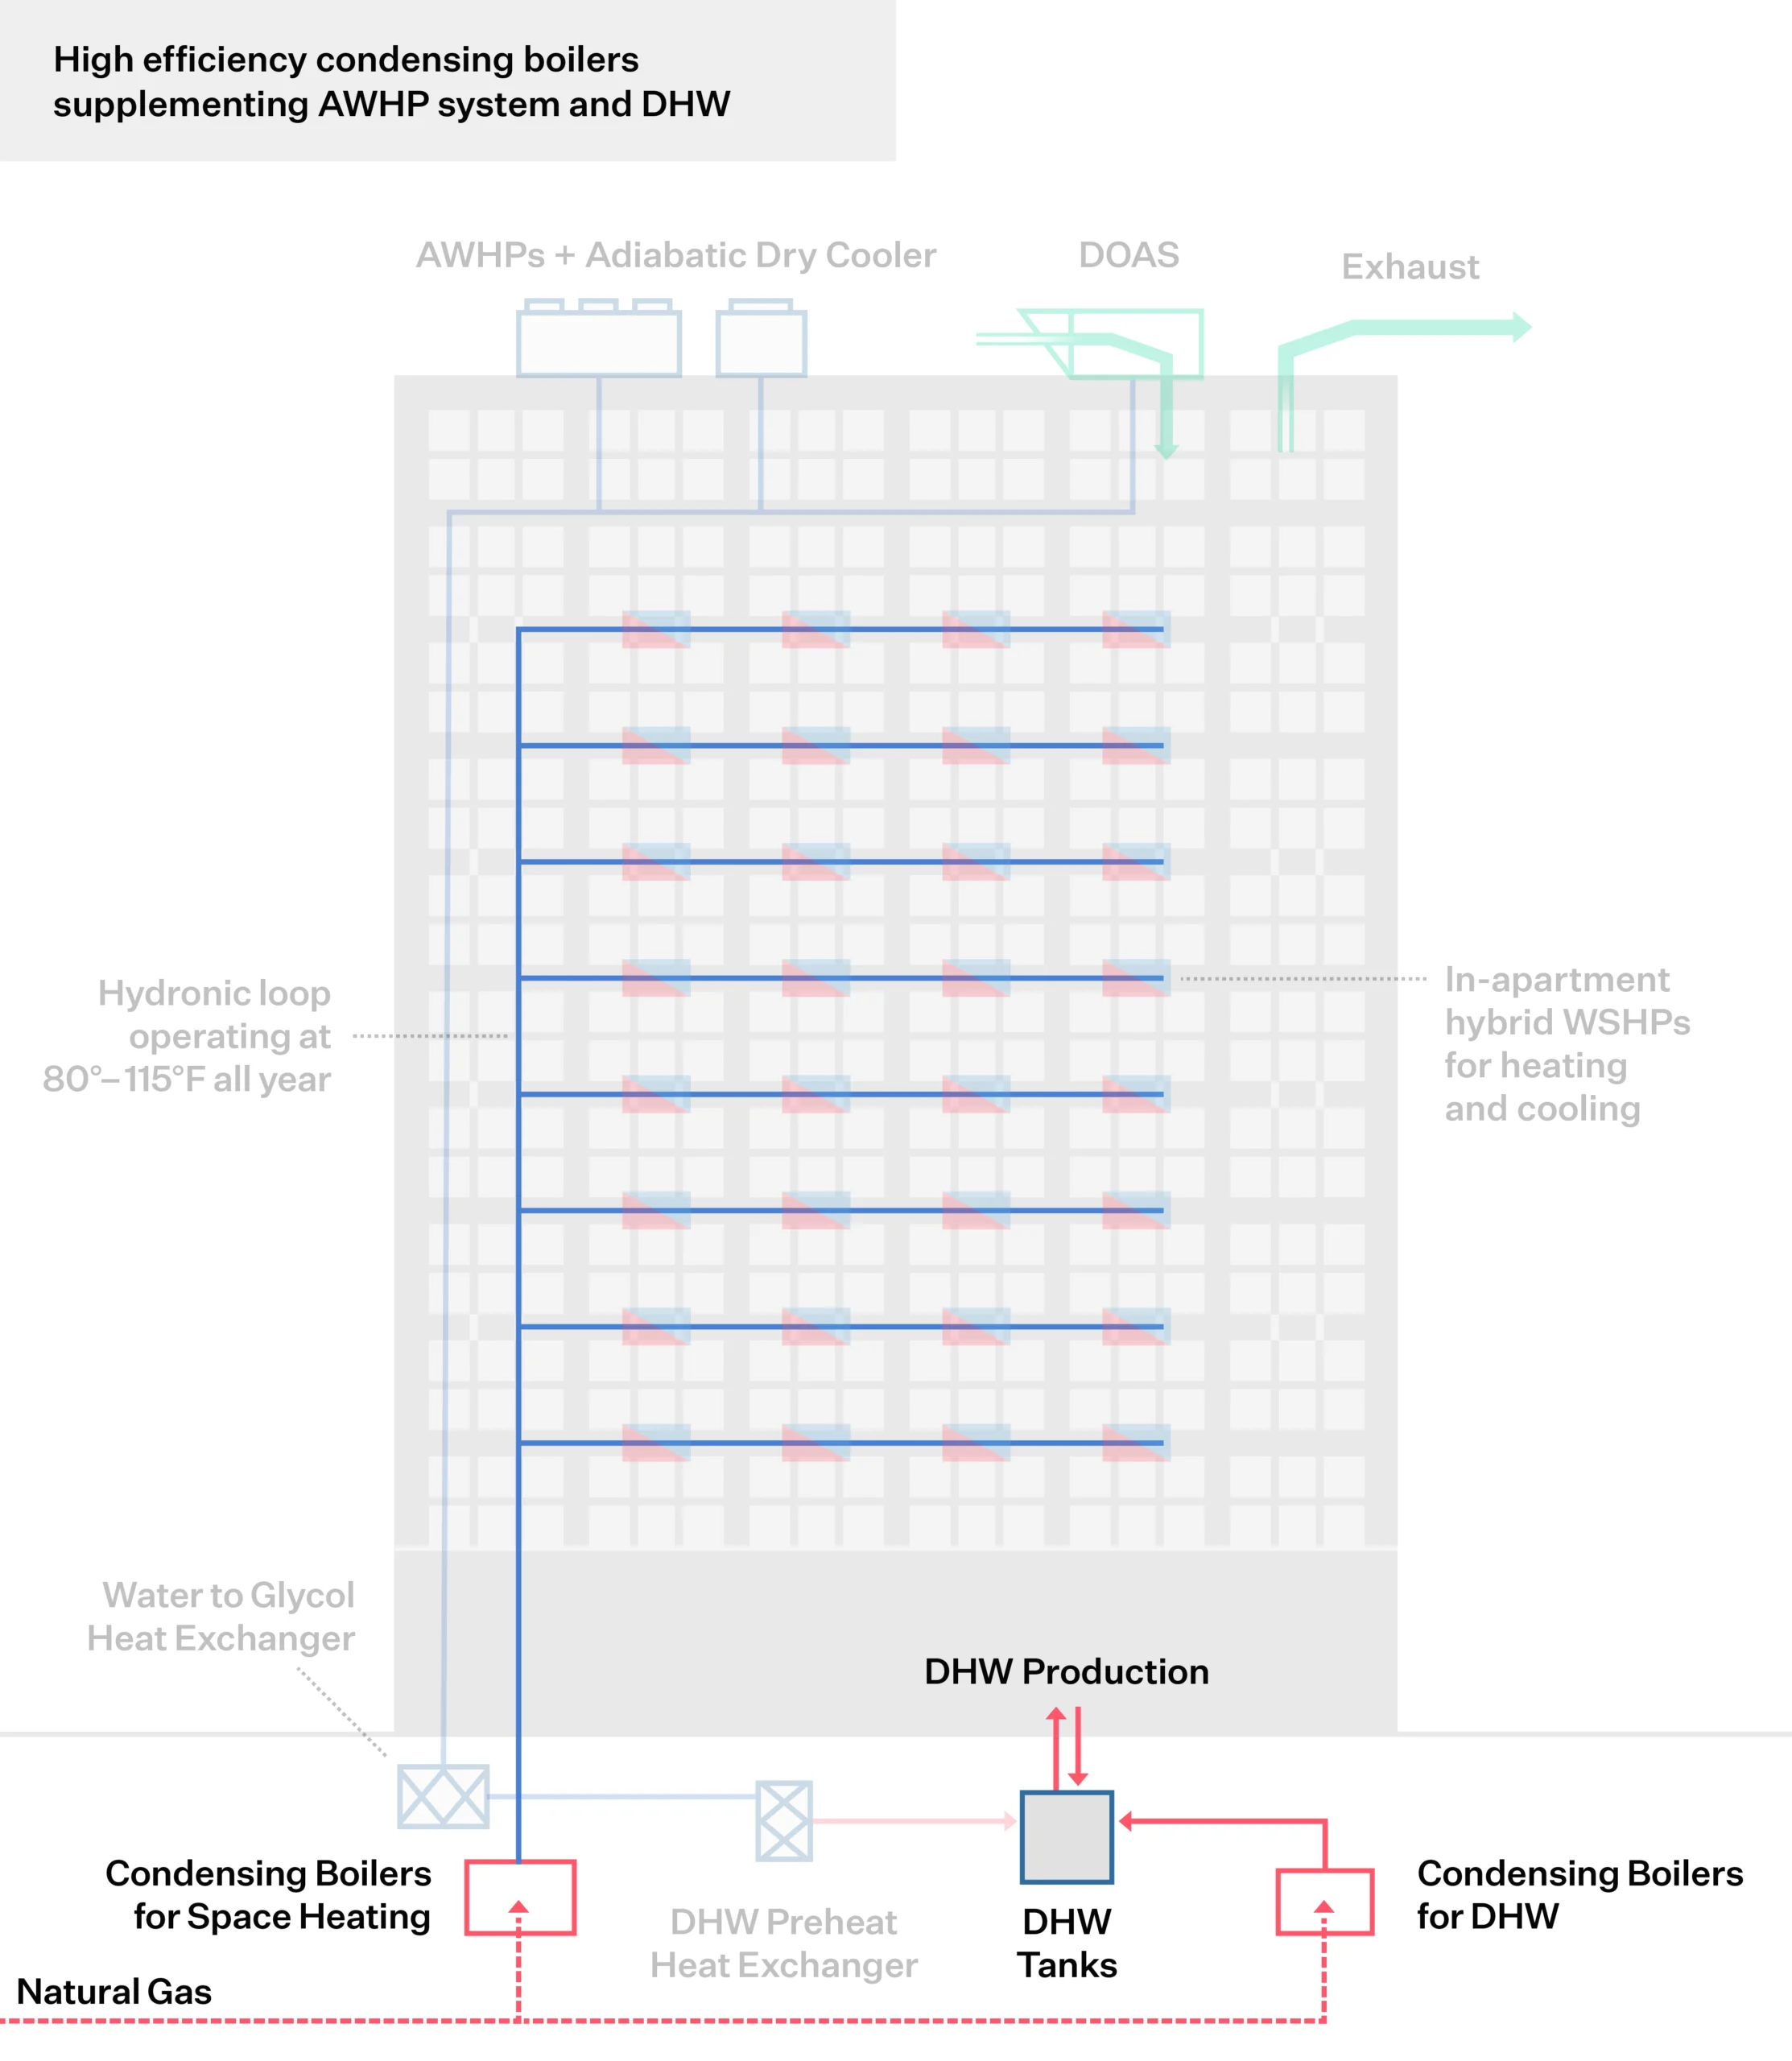
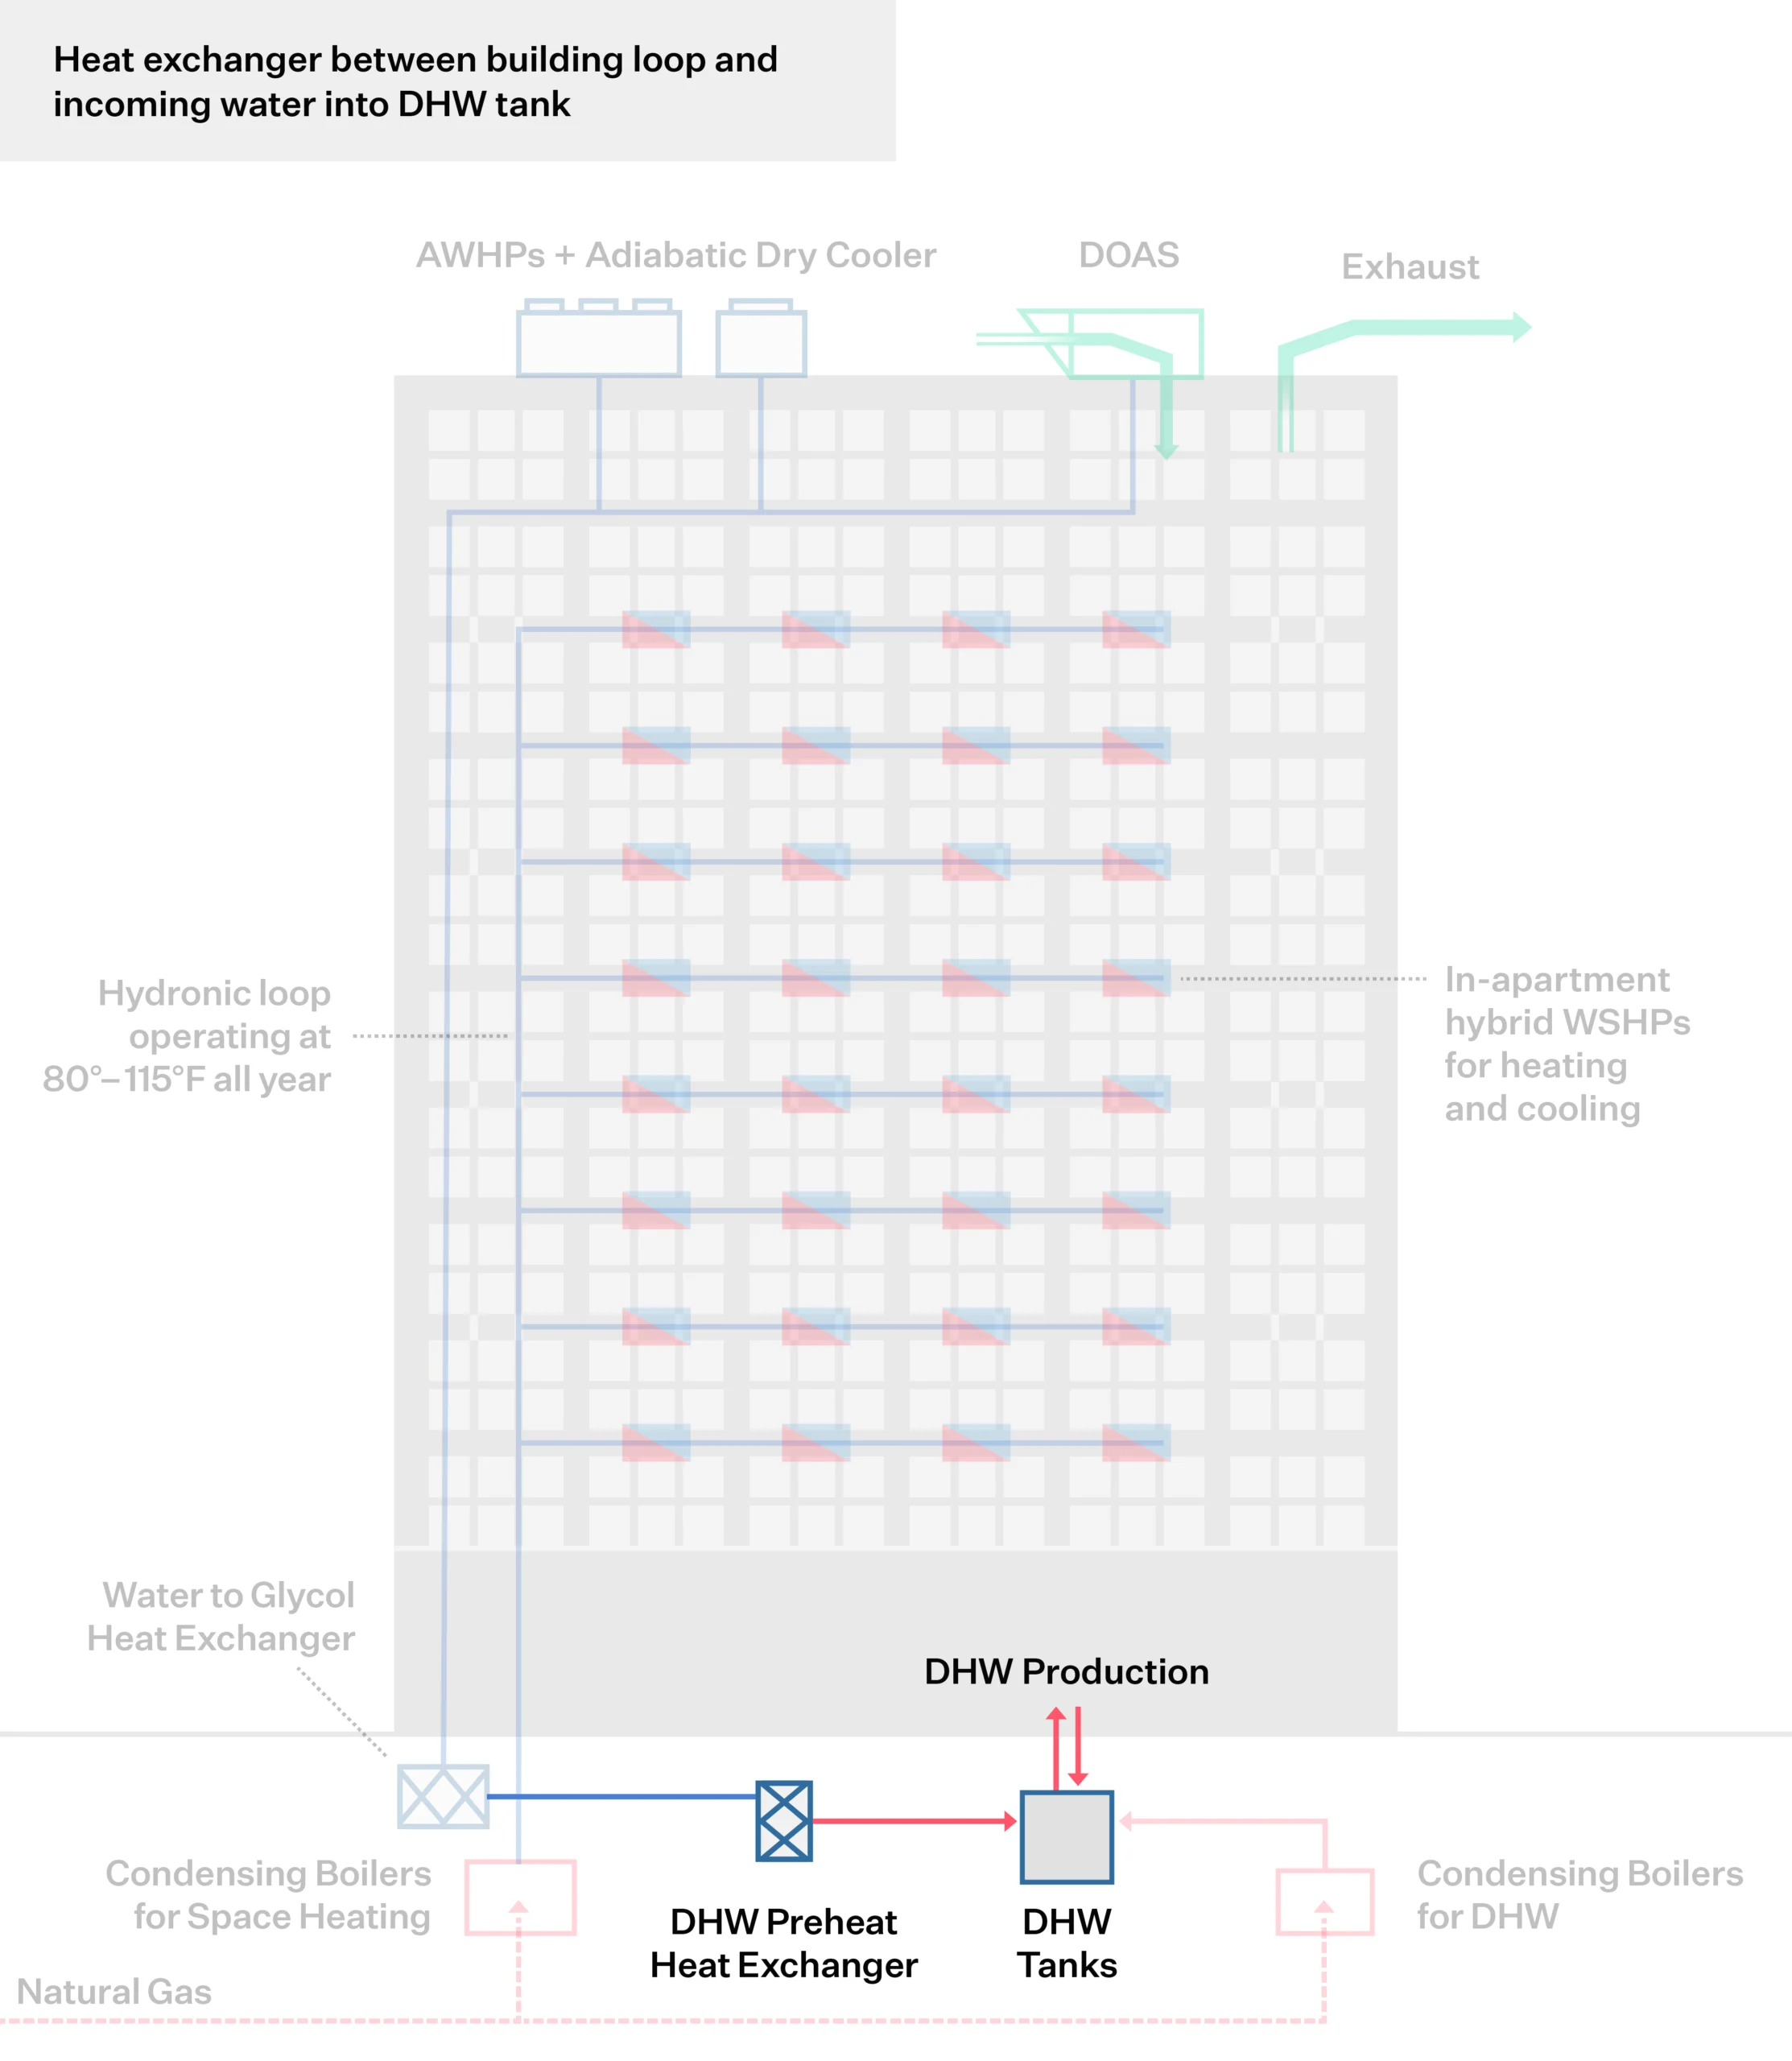
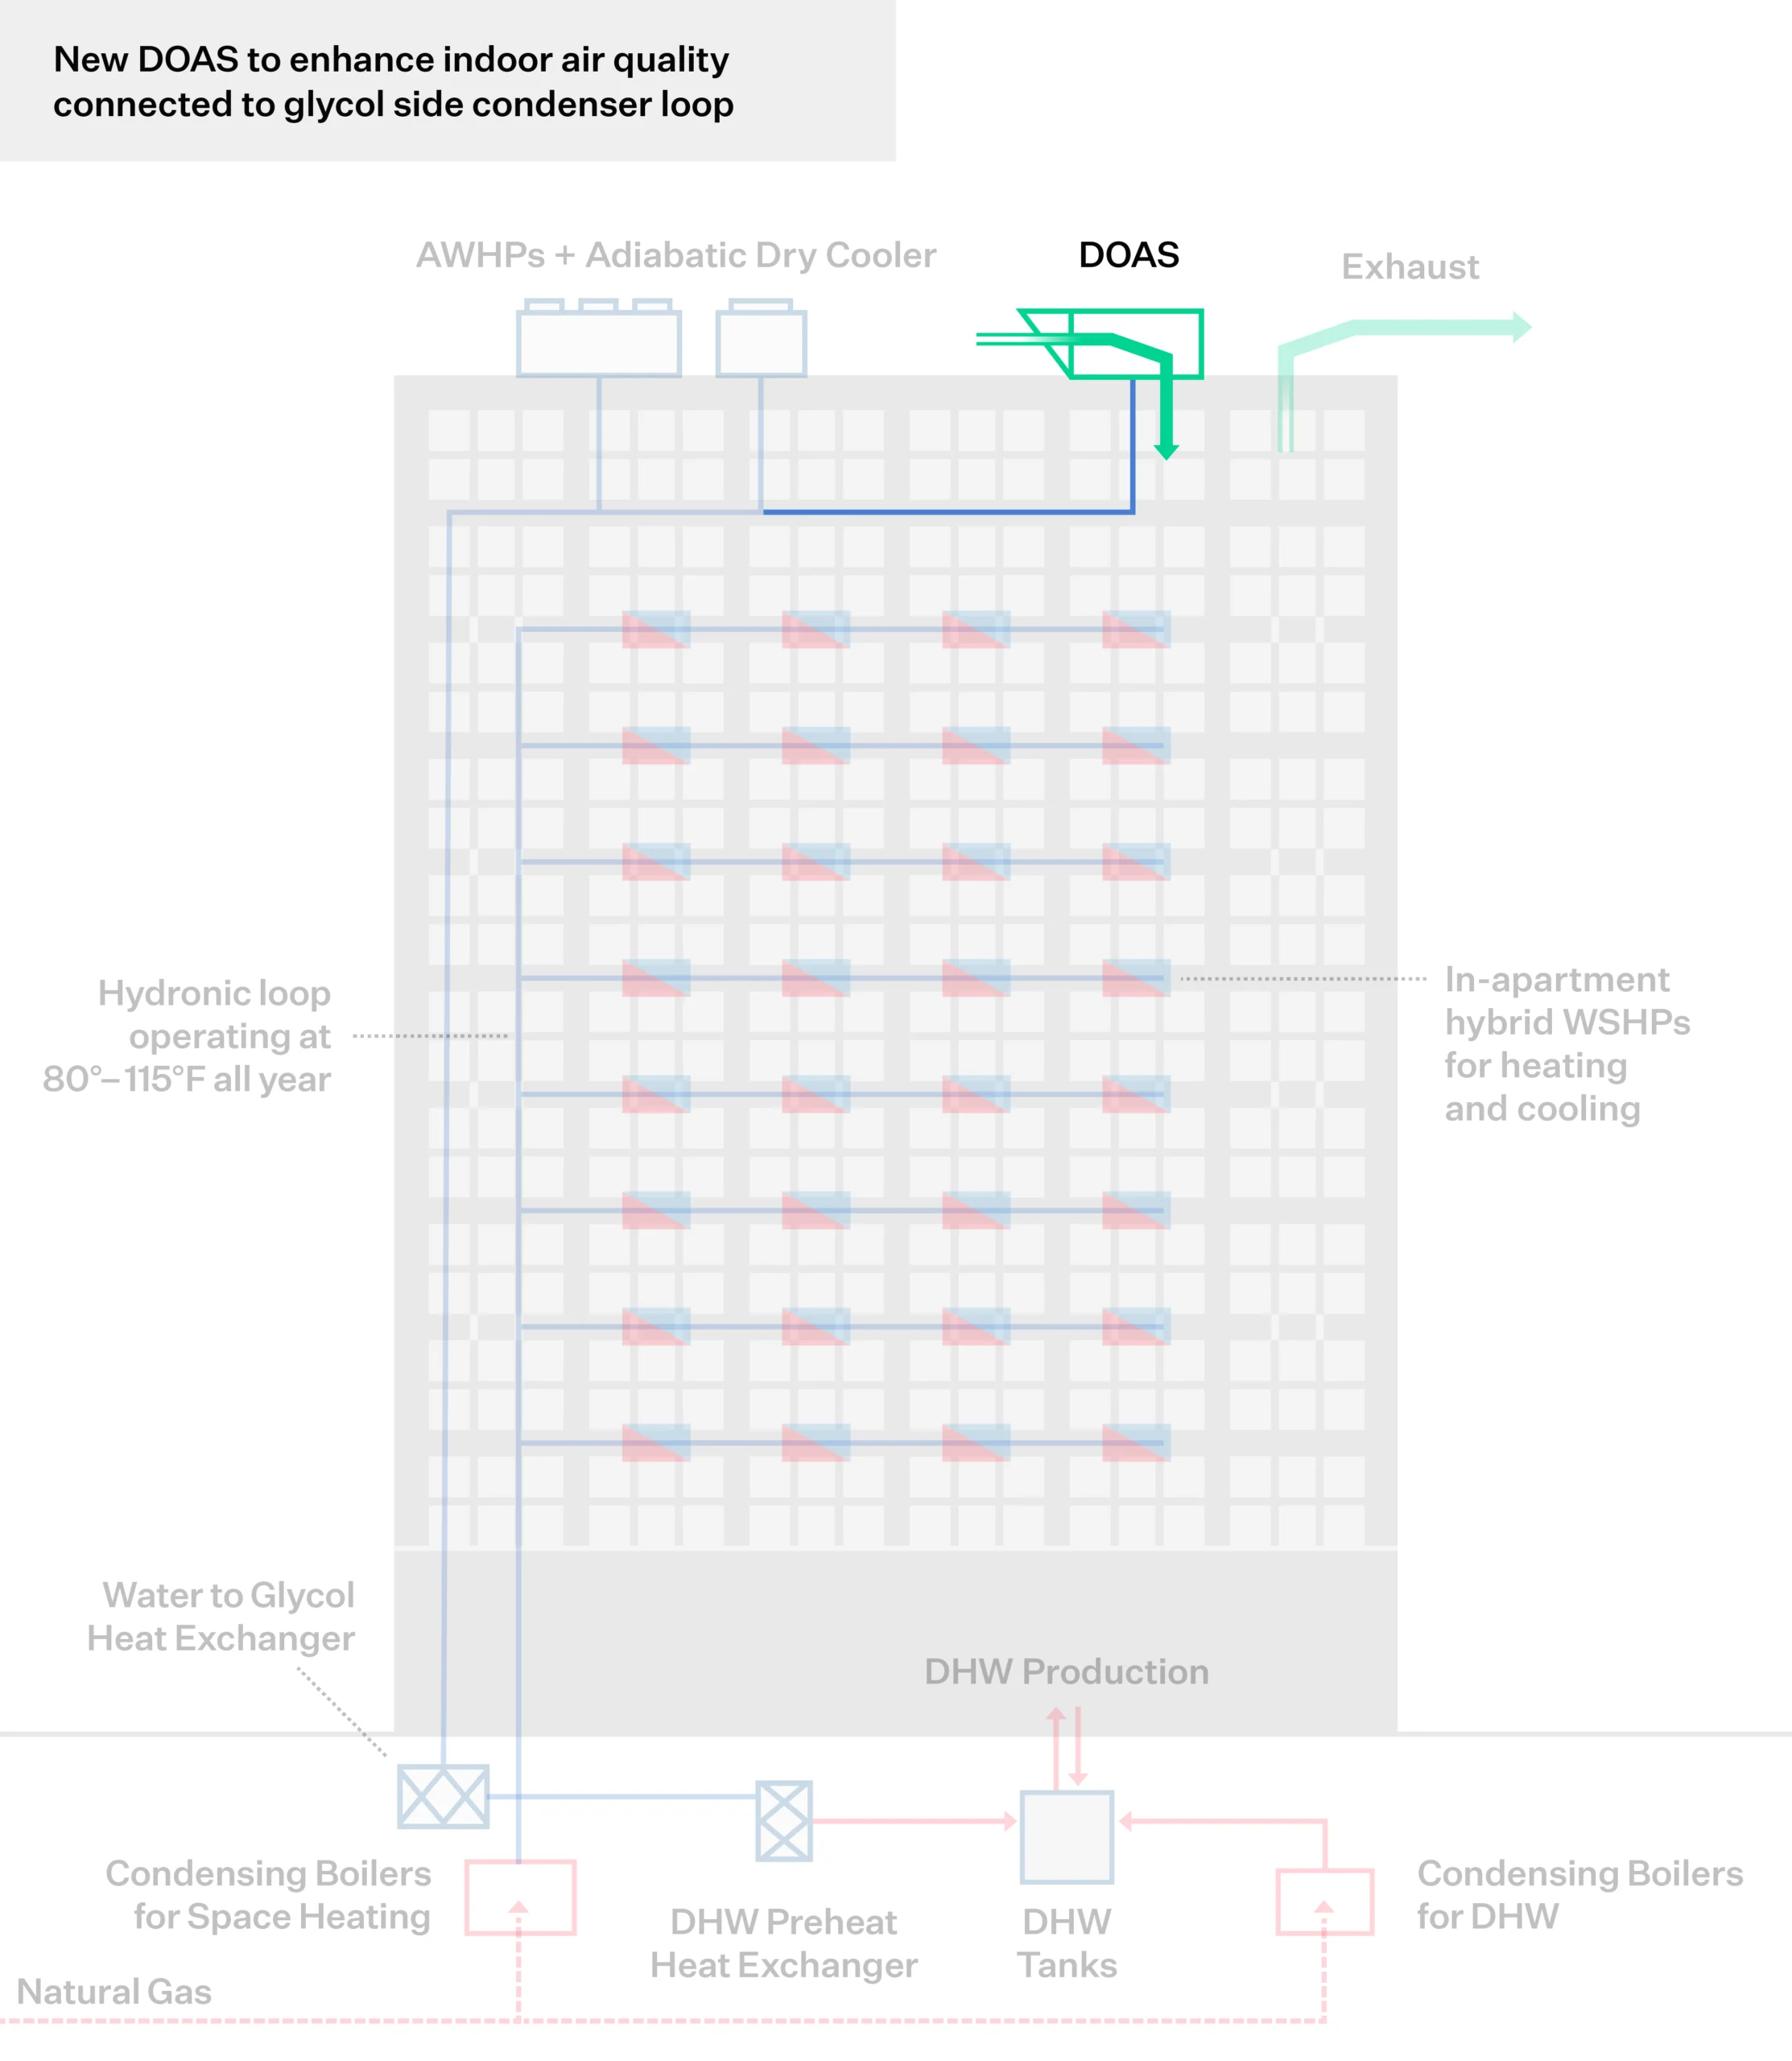
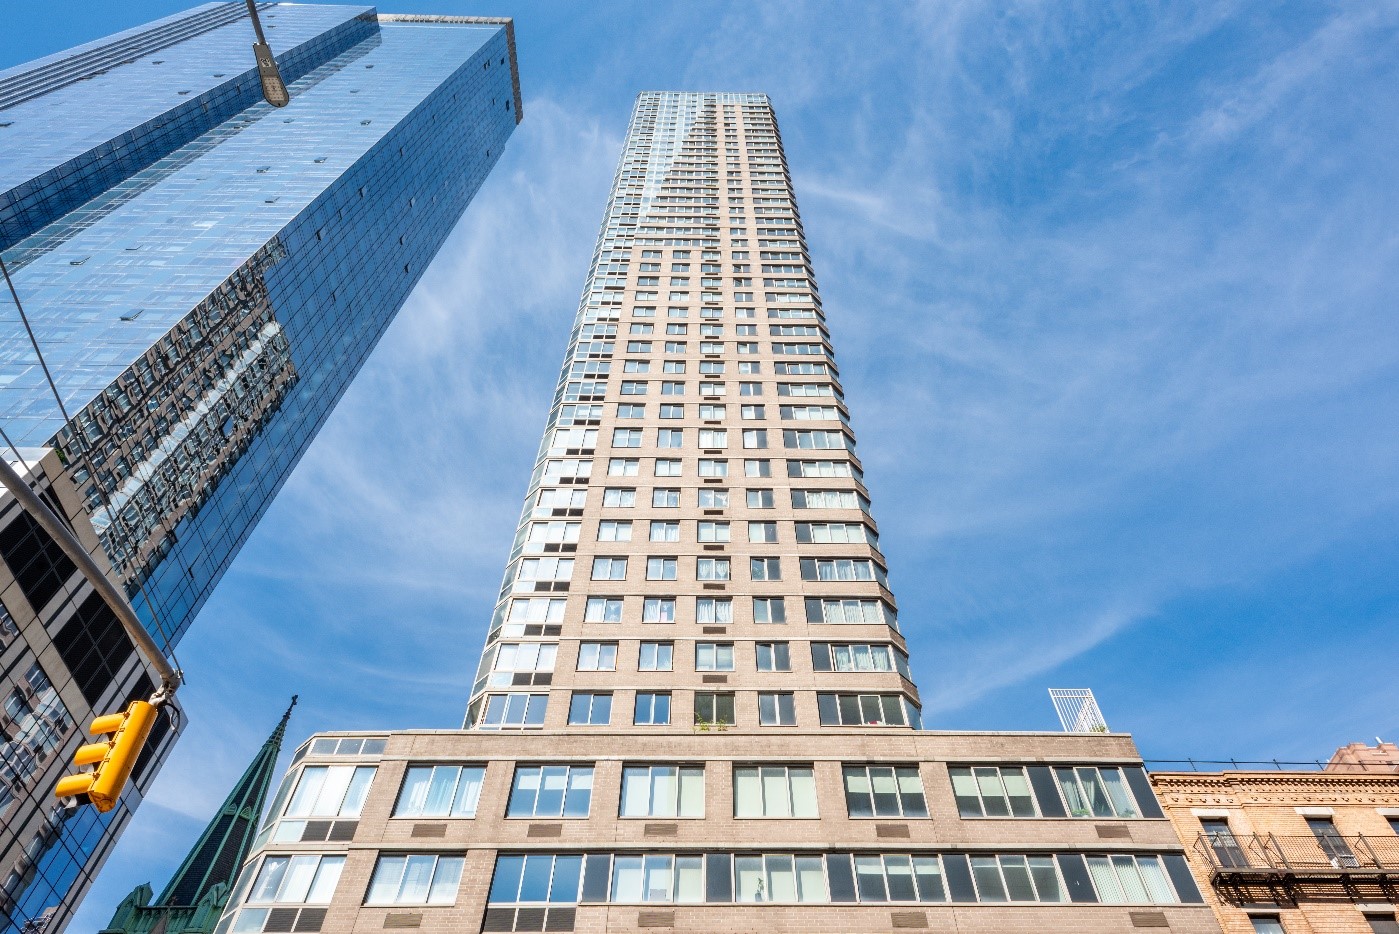
The International Tailoring Company Building (ITCoB), a historic 13-floor, 180-unit residential property in Manhattan, has undergone a transformative decarbonization retrofit to address aging infrastructure, enhance resident comfort, and comply with Local Law 97 (LL97) regulations. Constructed in 1920 and spanning 156,000 square feet, the building’s outdated two-pipe hydronic system with gas fired absorption chiller heaters, was replaced with a modern low-temperature thermal network that enables heat recovery between apartments and significantly improves heating and cooling efficiency. The project integrates air-to-water and hybrid water-source heat pumps and condensing boilers for supplemental heating. The project also includes a new Dedicated Outdoor Air System (DOAS) to enhance indoor air quality. An adiabatic dry cooler has replaced the cooling tower, reducing water and chemical costs while optimizing rooftop space for the new systems. These upgrades reduce natural gas consumption by over 80%, raise the building’s energy grade to a B or higher, and align with New York City’s carbon reduction mandates, eliminating fines and future-proofing the property. By utilizing variable demand and speed technologies, the project achieves significant energy savings while positioning the building as a model for sustainable urban living.
Project Highlights
Energy Savings
80%
Completed retrofits reduce natural gas consumption by 80% and raise the building’s energy grade to a B or higher.
Cost Savings
Upgrades eliminate Local Law 97 fines and avoid escalating utility and maintenance costs tied to outdated systems.
Lessons Learned
This project established a resource-efficient pathway for decarbonization, enabling substantial energy savings without requiring a complex and costly envelope upgrade as a prerequisite – in fact, future envelope upgrades will enhance efficiency.
Step 1
Step 1: Examine Current Conditions
A baseline assessment is key to understanding current systems and performance, then identifying conditions, requirements or events that will trigger a decarbonization effort. The assessment looks across technical systems, asset strategy and sectoral factors.
Building System Conditions

- Equipment nearing end-of-life
- Comfort improvements
- Indoor air quality improvements
- Resilience upgrades
- Efficiency improvements
Asset Conditions

- Recapitalization
- Carbon emissions limits
Market Conditions

- Market demand changes
- Policy changes
- Infrastructure transitions
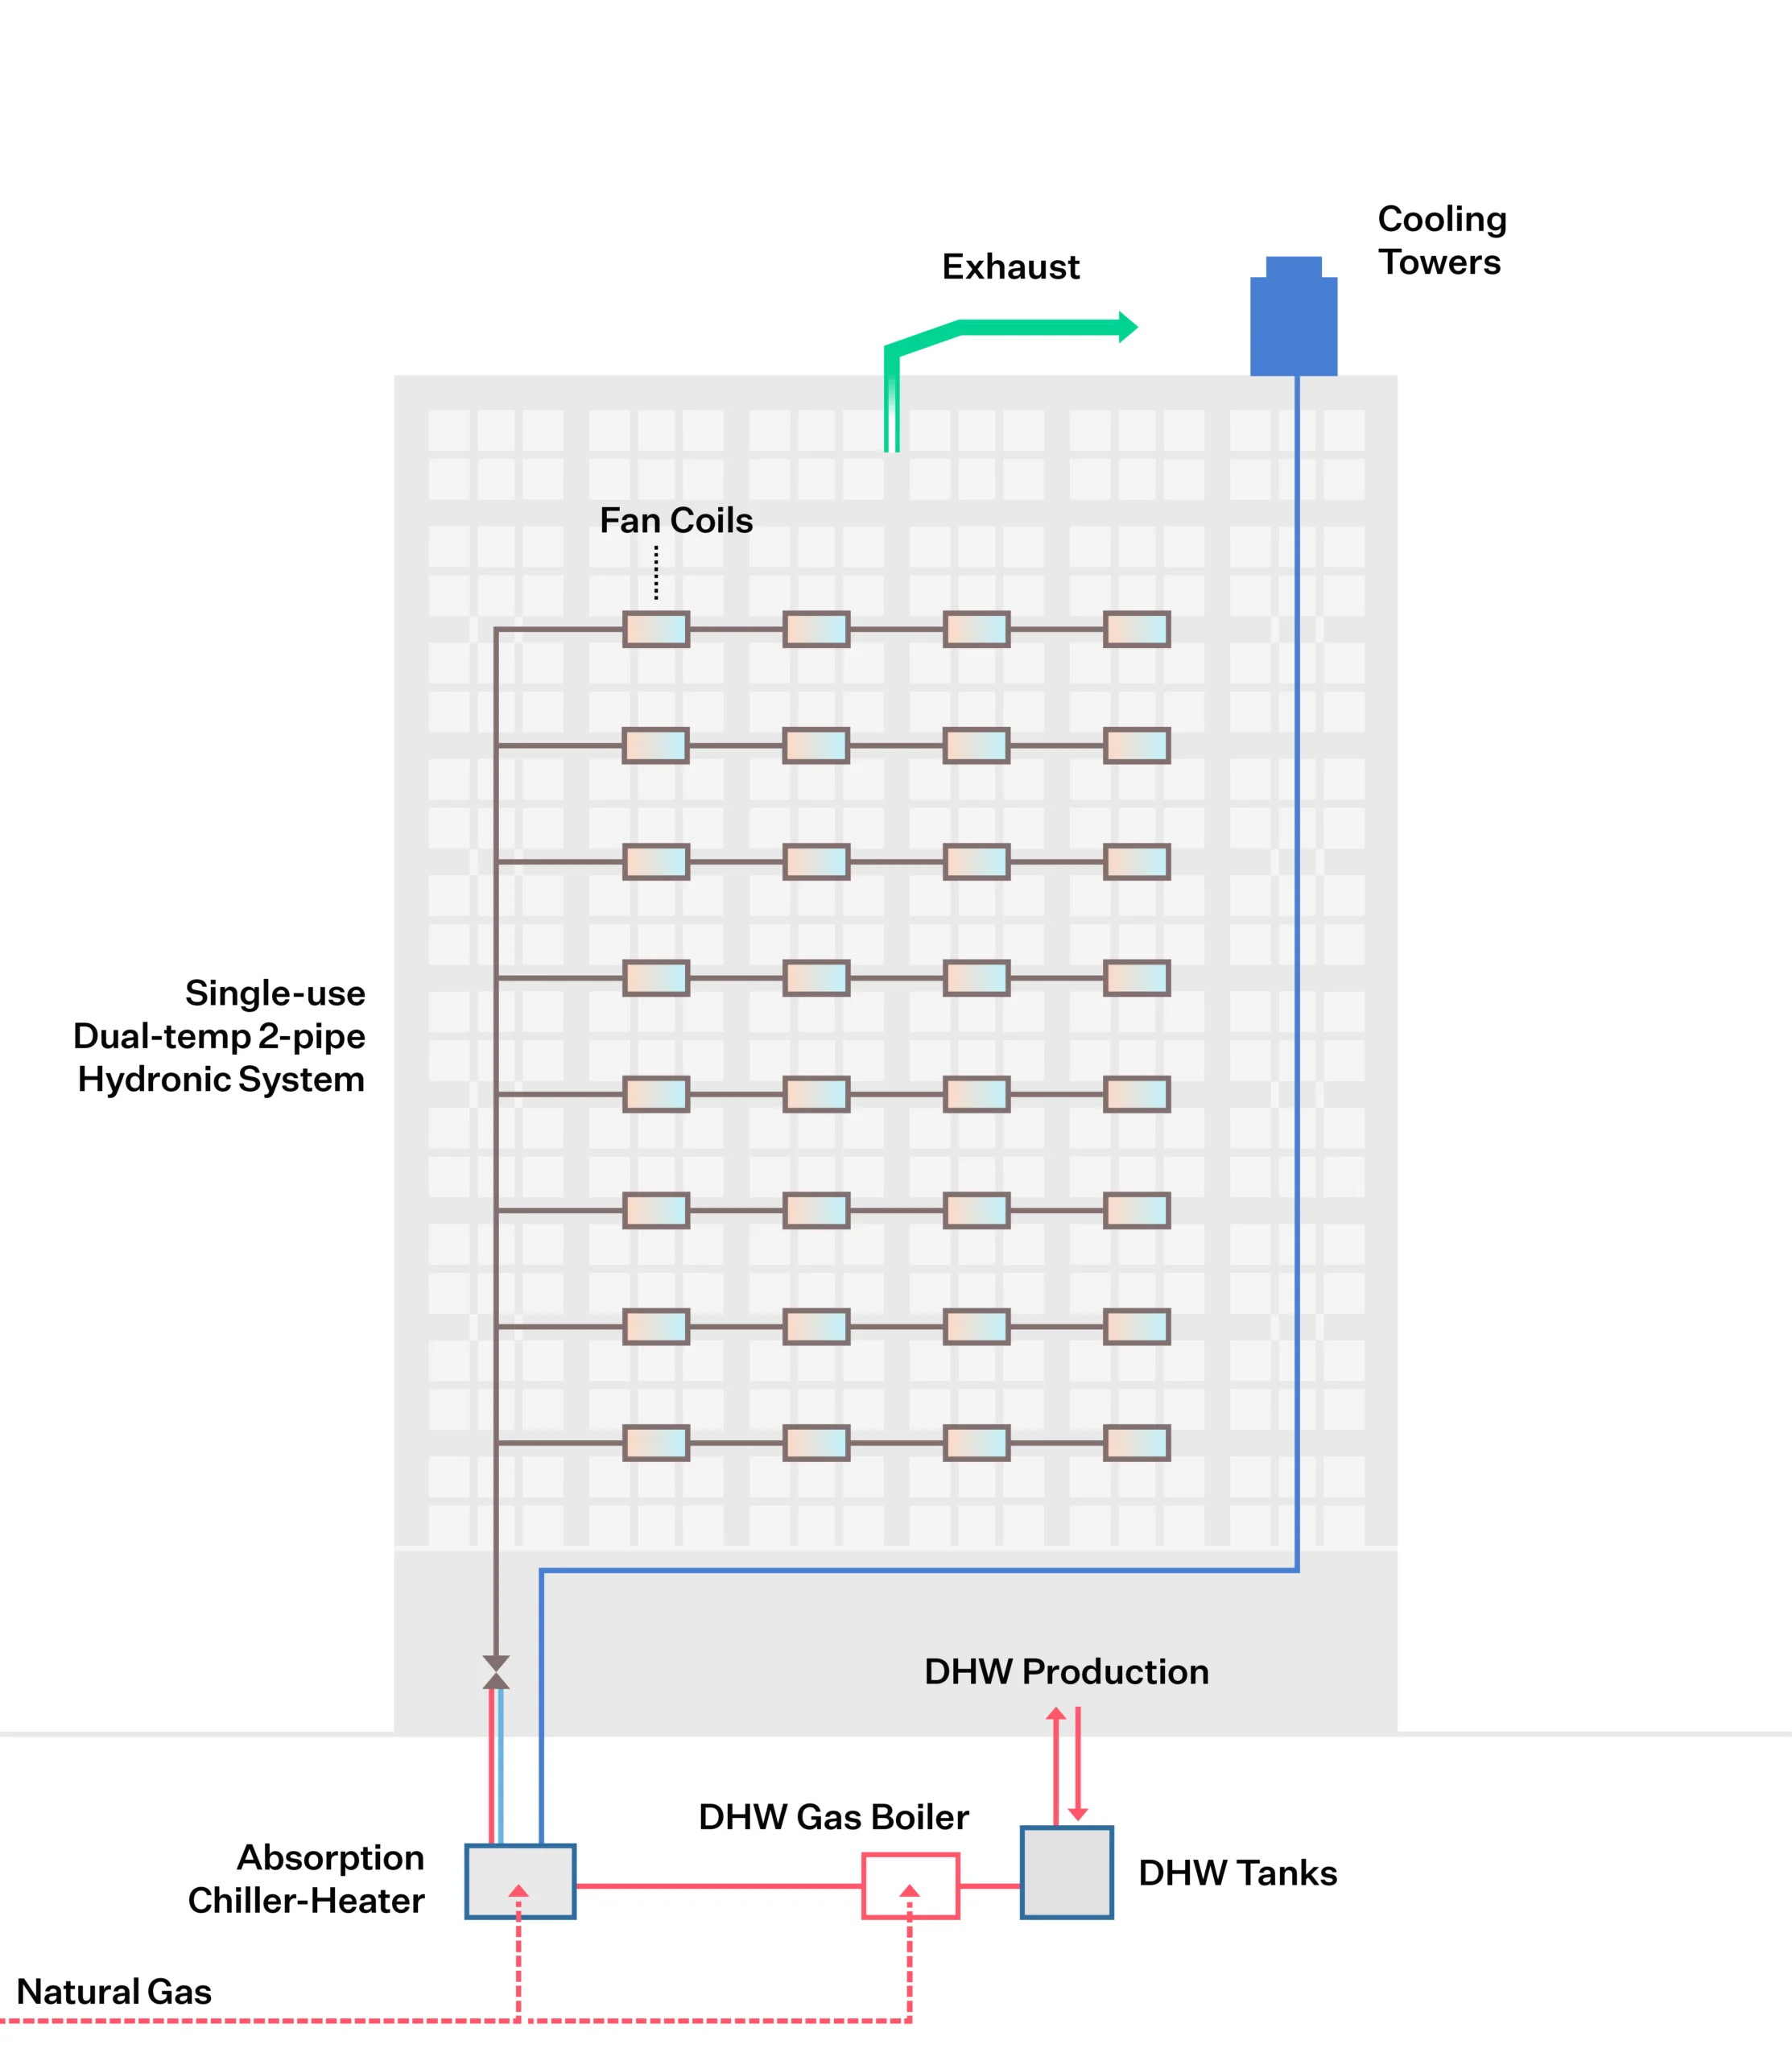
The decarbonization plan for ITCoB addressed critical building, asset, and market conditions. Constructed in 1920 and converted into residential lofts in 1980, the building faced challenges with aging, inefficient equipment and a poorly performing two-pipe hydronic HVAC system. Residents frequently experienced discomfort due to the system’s inability to provide simultaneous heating and cooling, especially during shoulder seasons. Market pressures, including Local Law 97 (LL97) fines and the building’s D-grade energy rating, necessitated a sustainable solution. The end-of-life status of key equipment created an opportunity to reimagine the energy systems rather than opting for in-kind replacements, leading to a plan leveraging a modern thermal network and hybrid systems to maximize efficiency and future-proof the building.
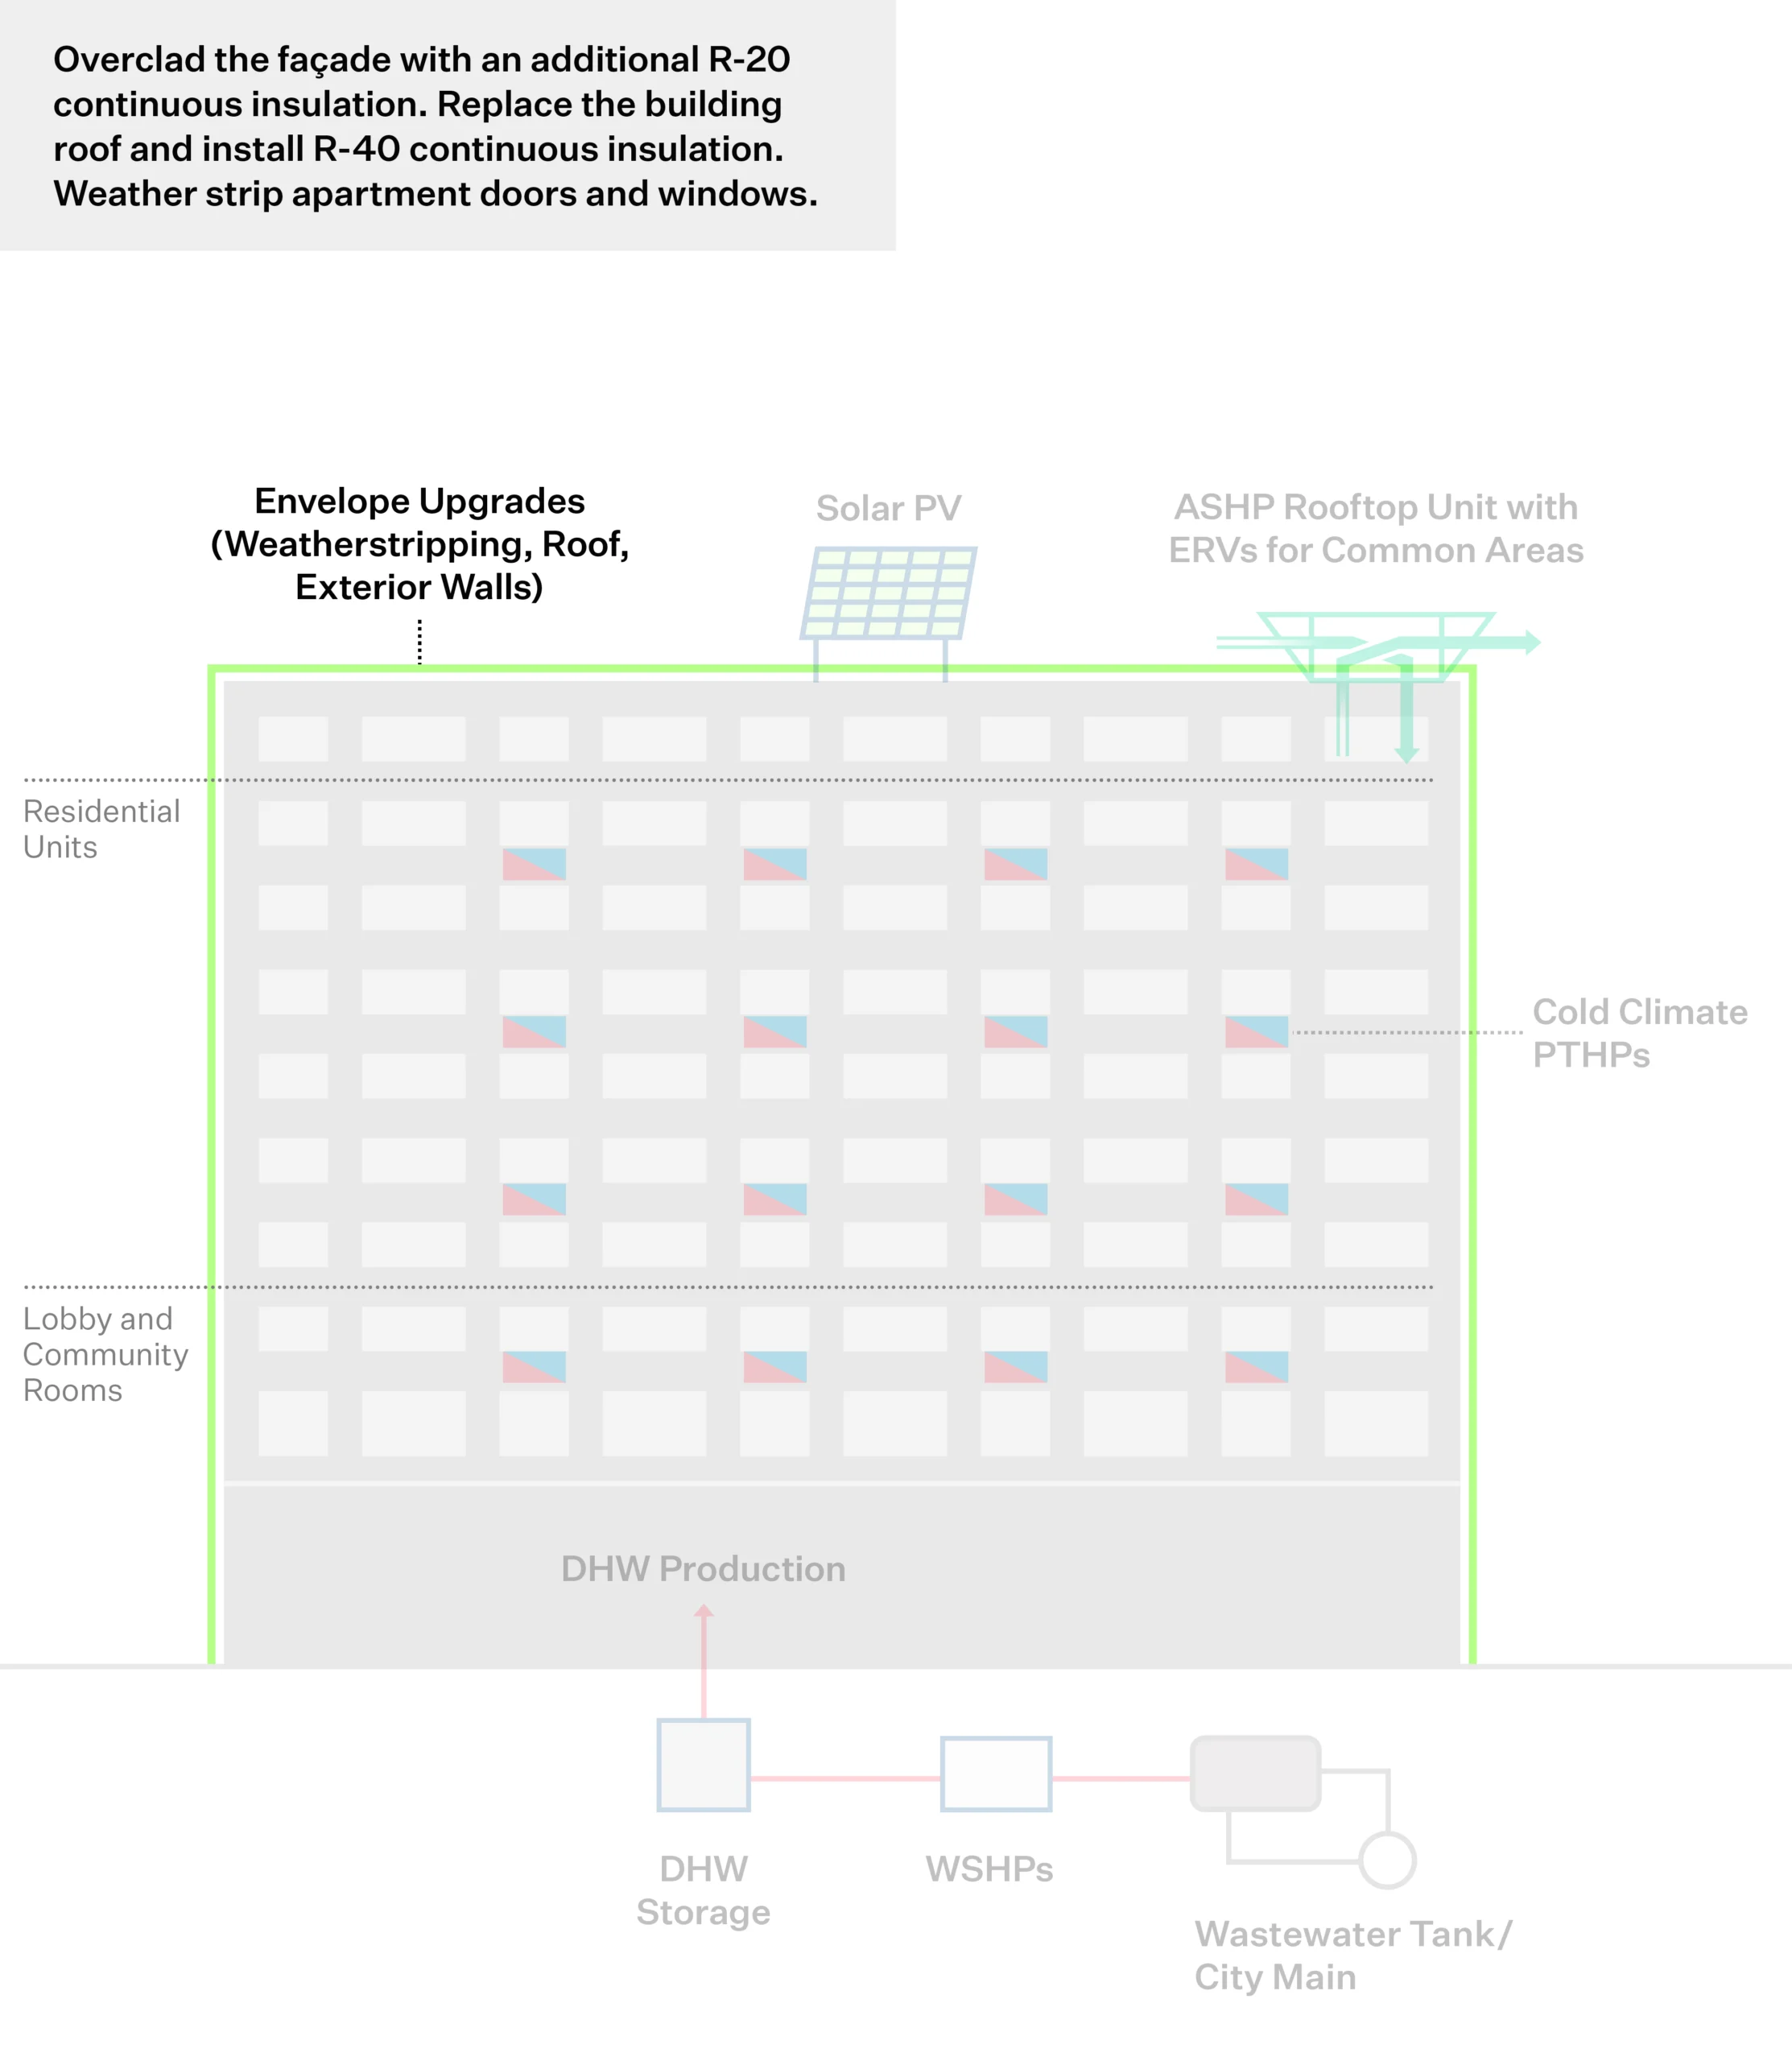
Complicating the project was the building’s poor thermal envelope, with leaky single-pane steel-frame windows requiring costly refurbishment to maintain aesthetics. Immediate electrification was prioritized as the HVAC equipment could not wait for envelope upgrades. The hybrid system provides a resource-efficient decarbonization pathway, operating effectively within current conditions while avoiding oversizing. Once the envelope is improved, the system will operate at even greater efficiency, supporting lower temperatures and enhancing long-term performance. This approach balances immediate needs with a sustainable vision for the future
Step 2
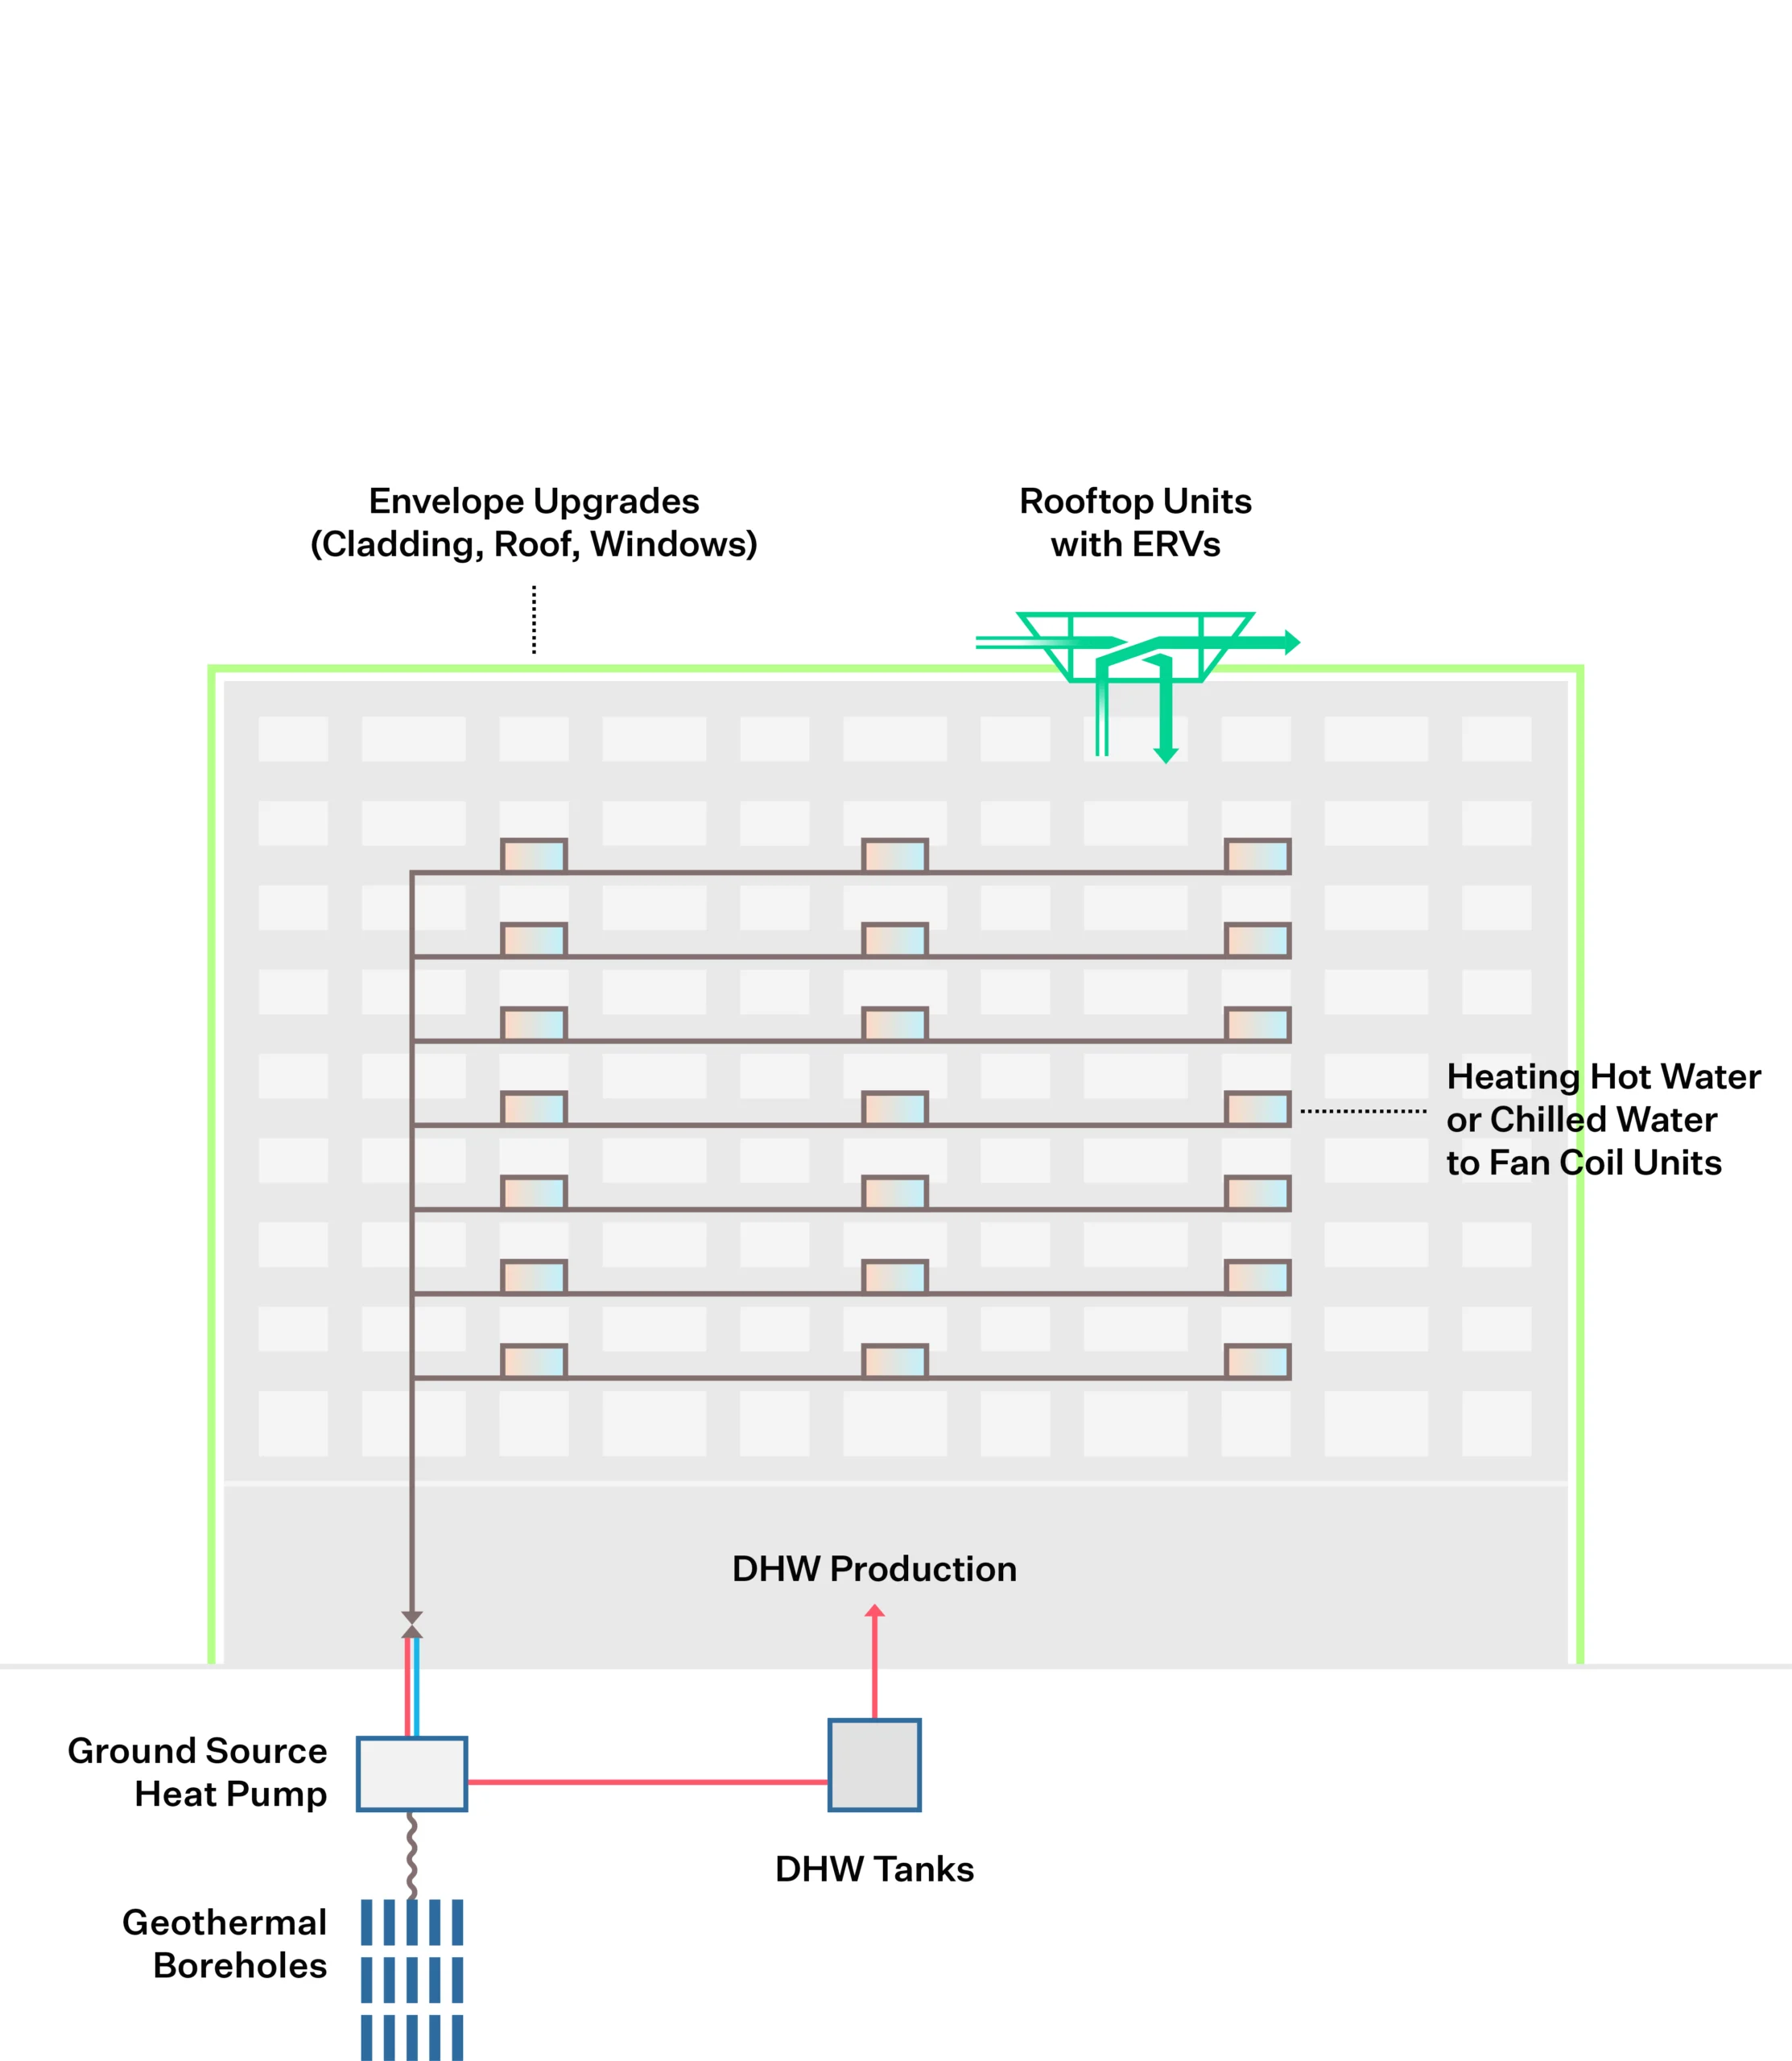
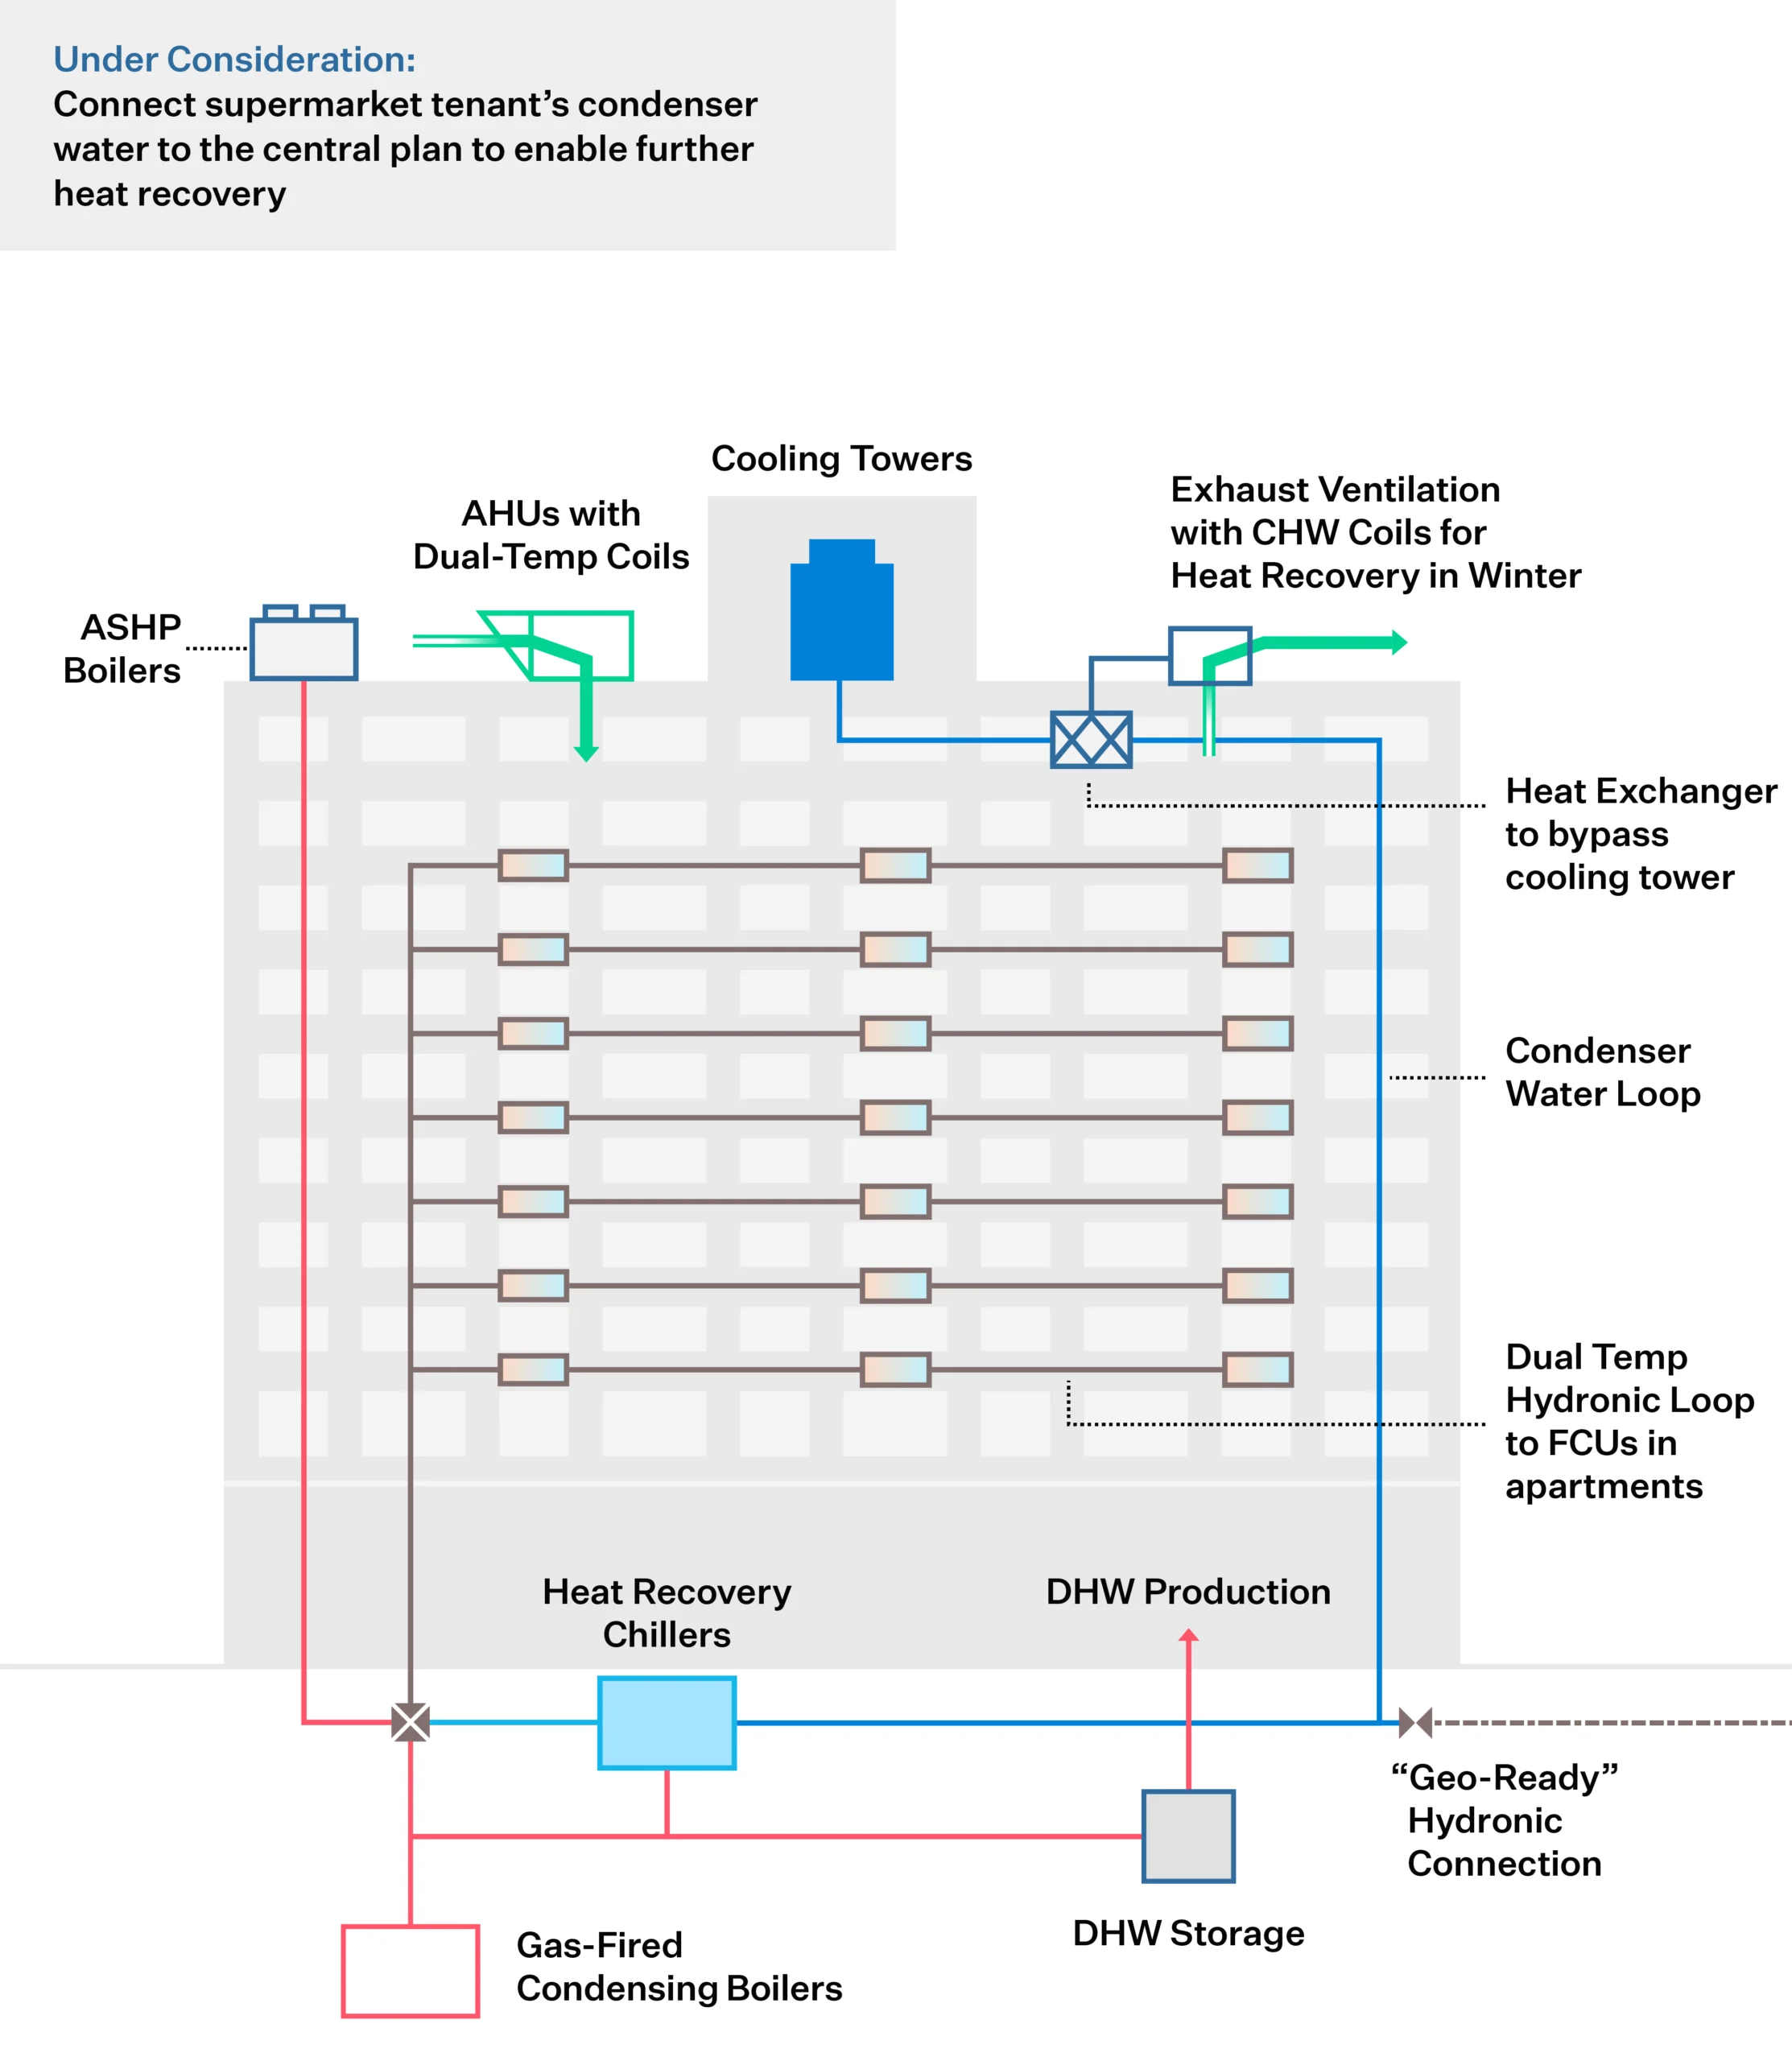
Step 2: Design Resource Efficient Solutions
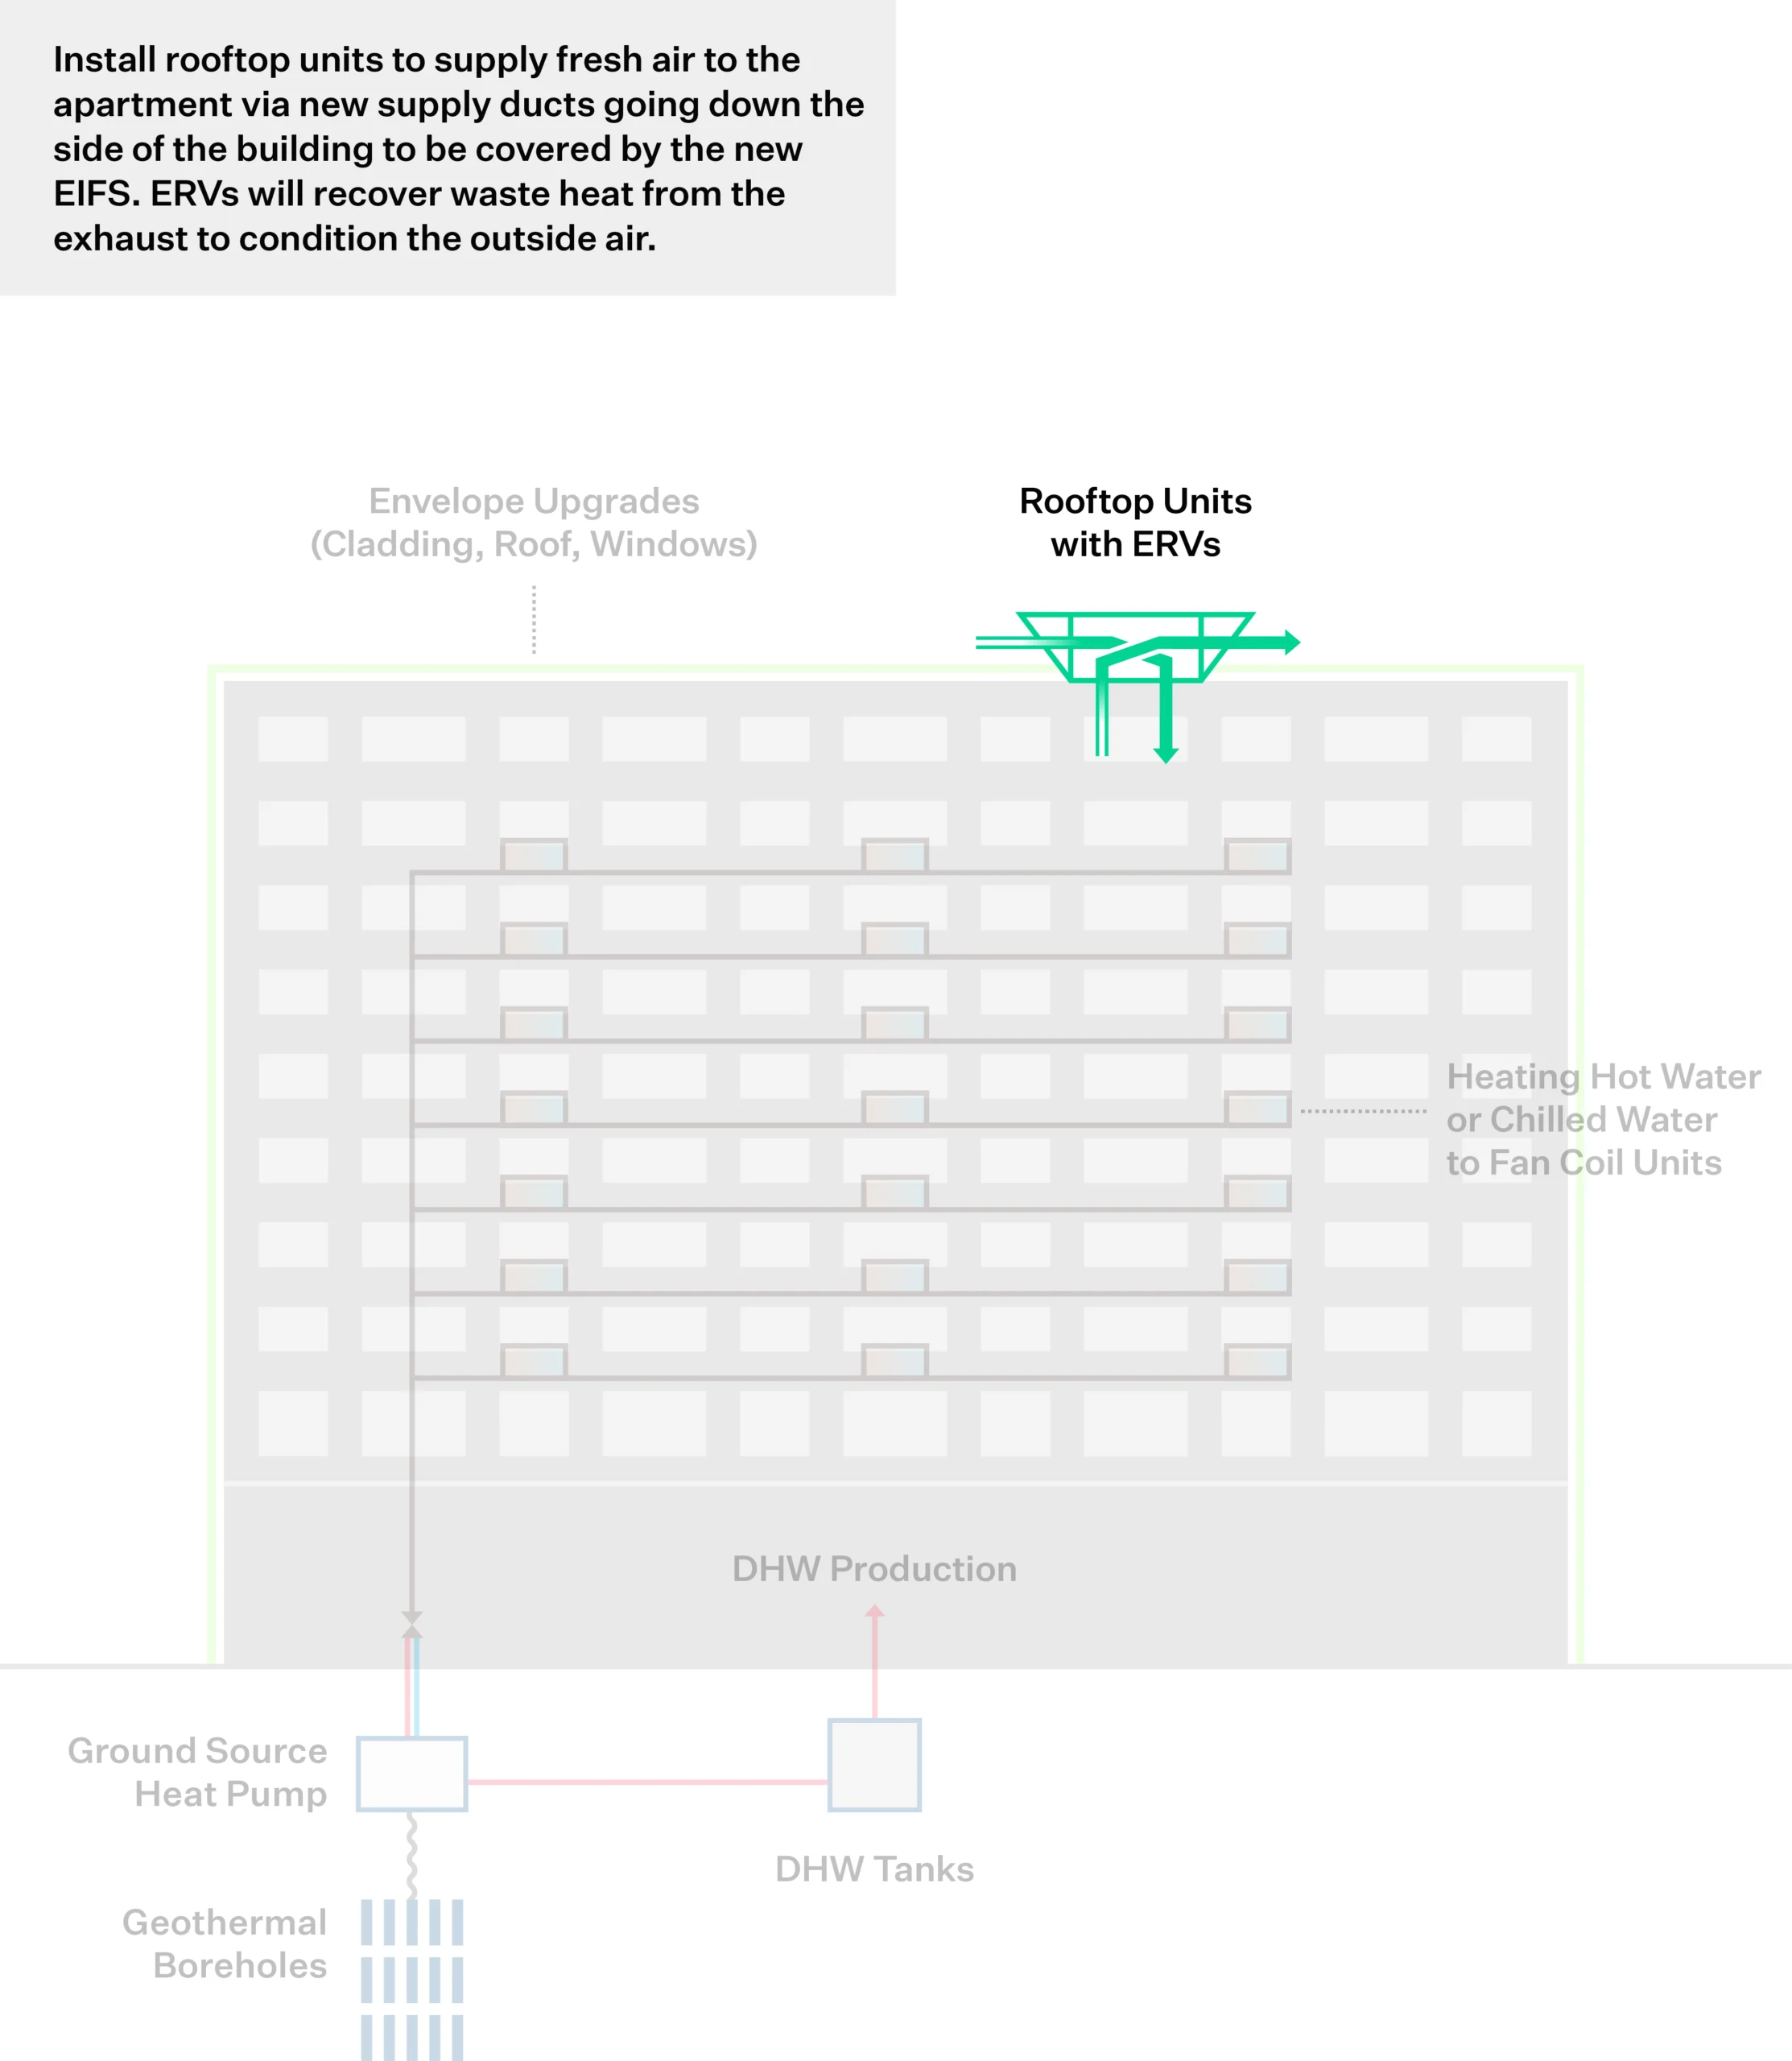
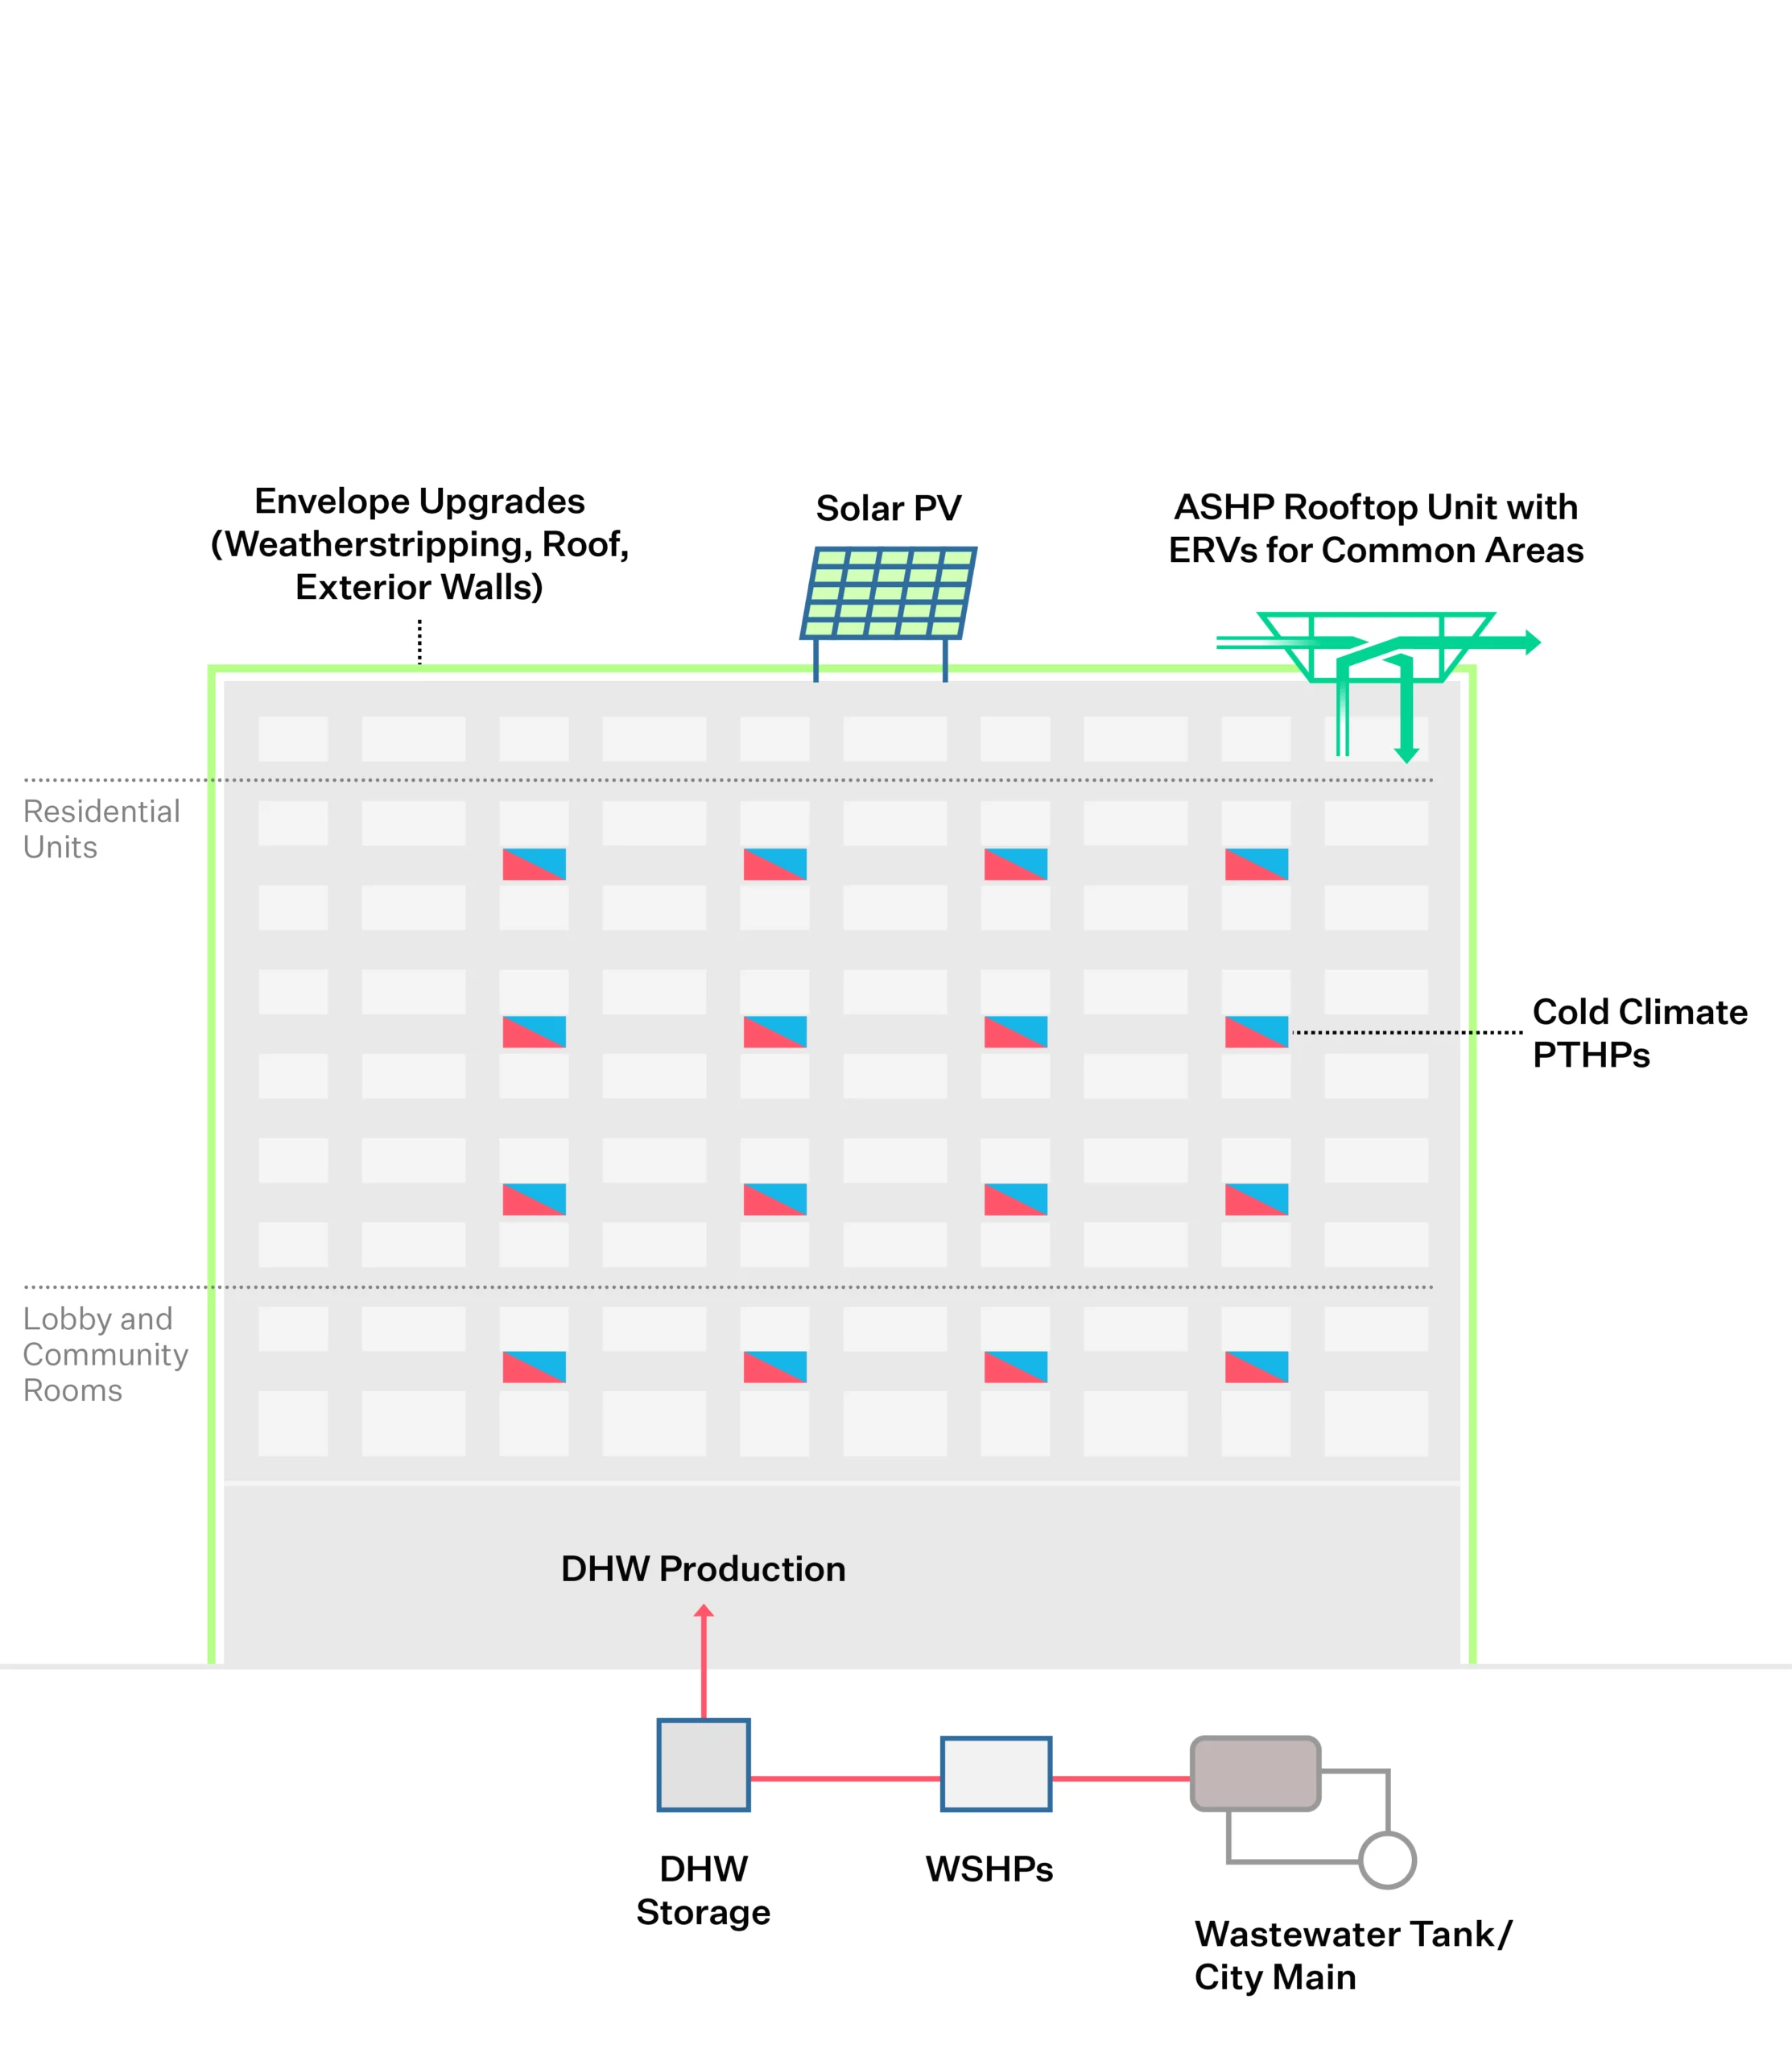
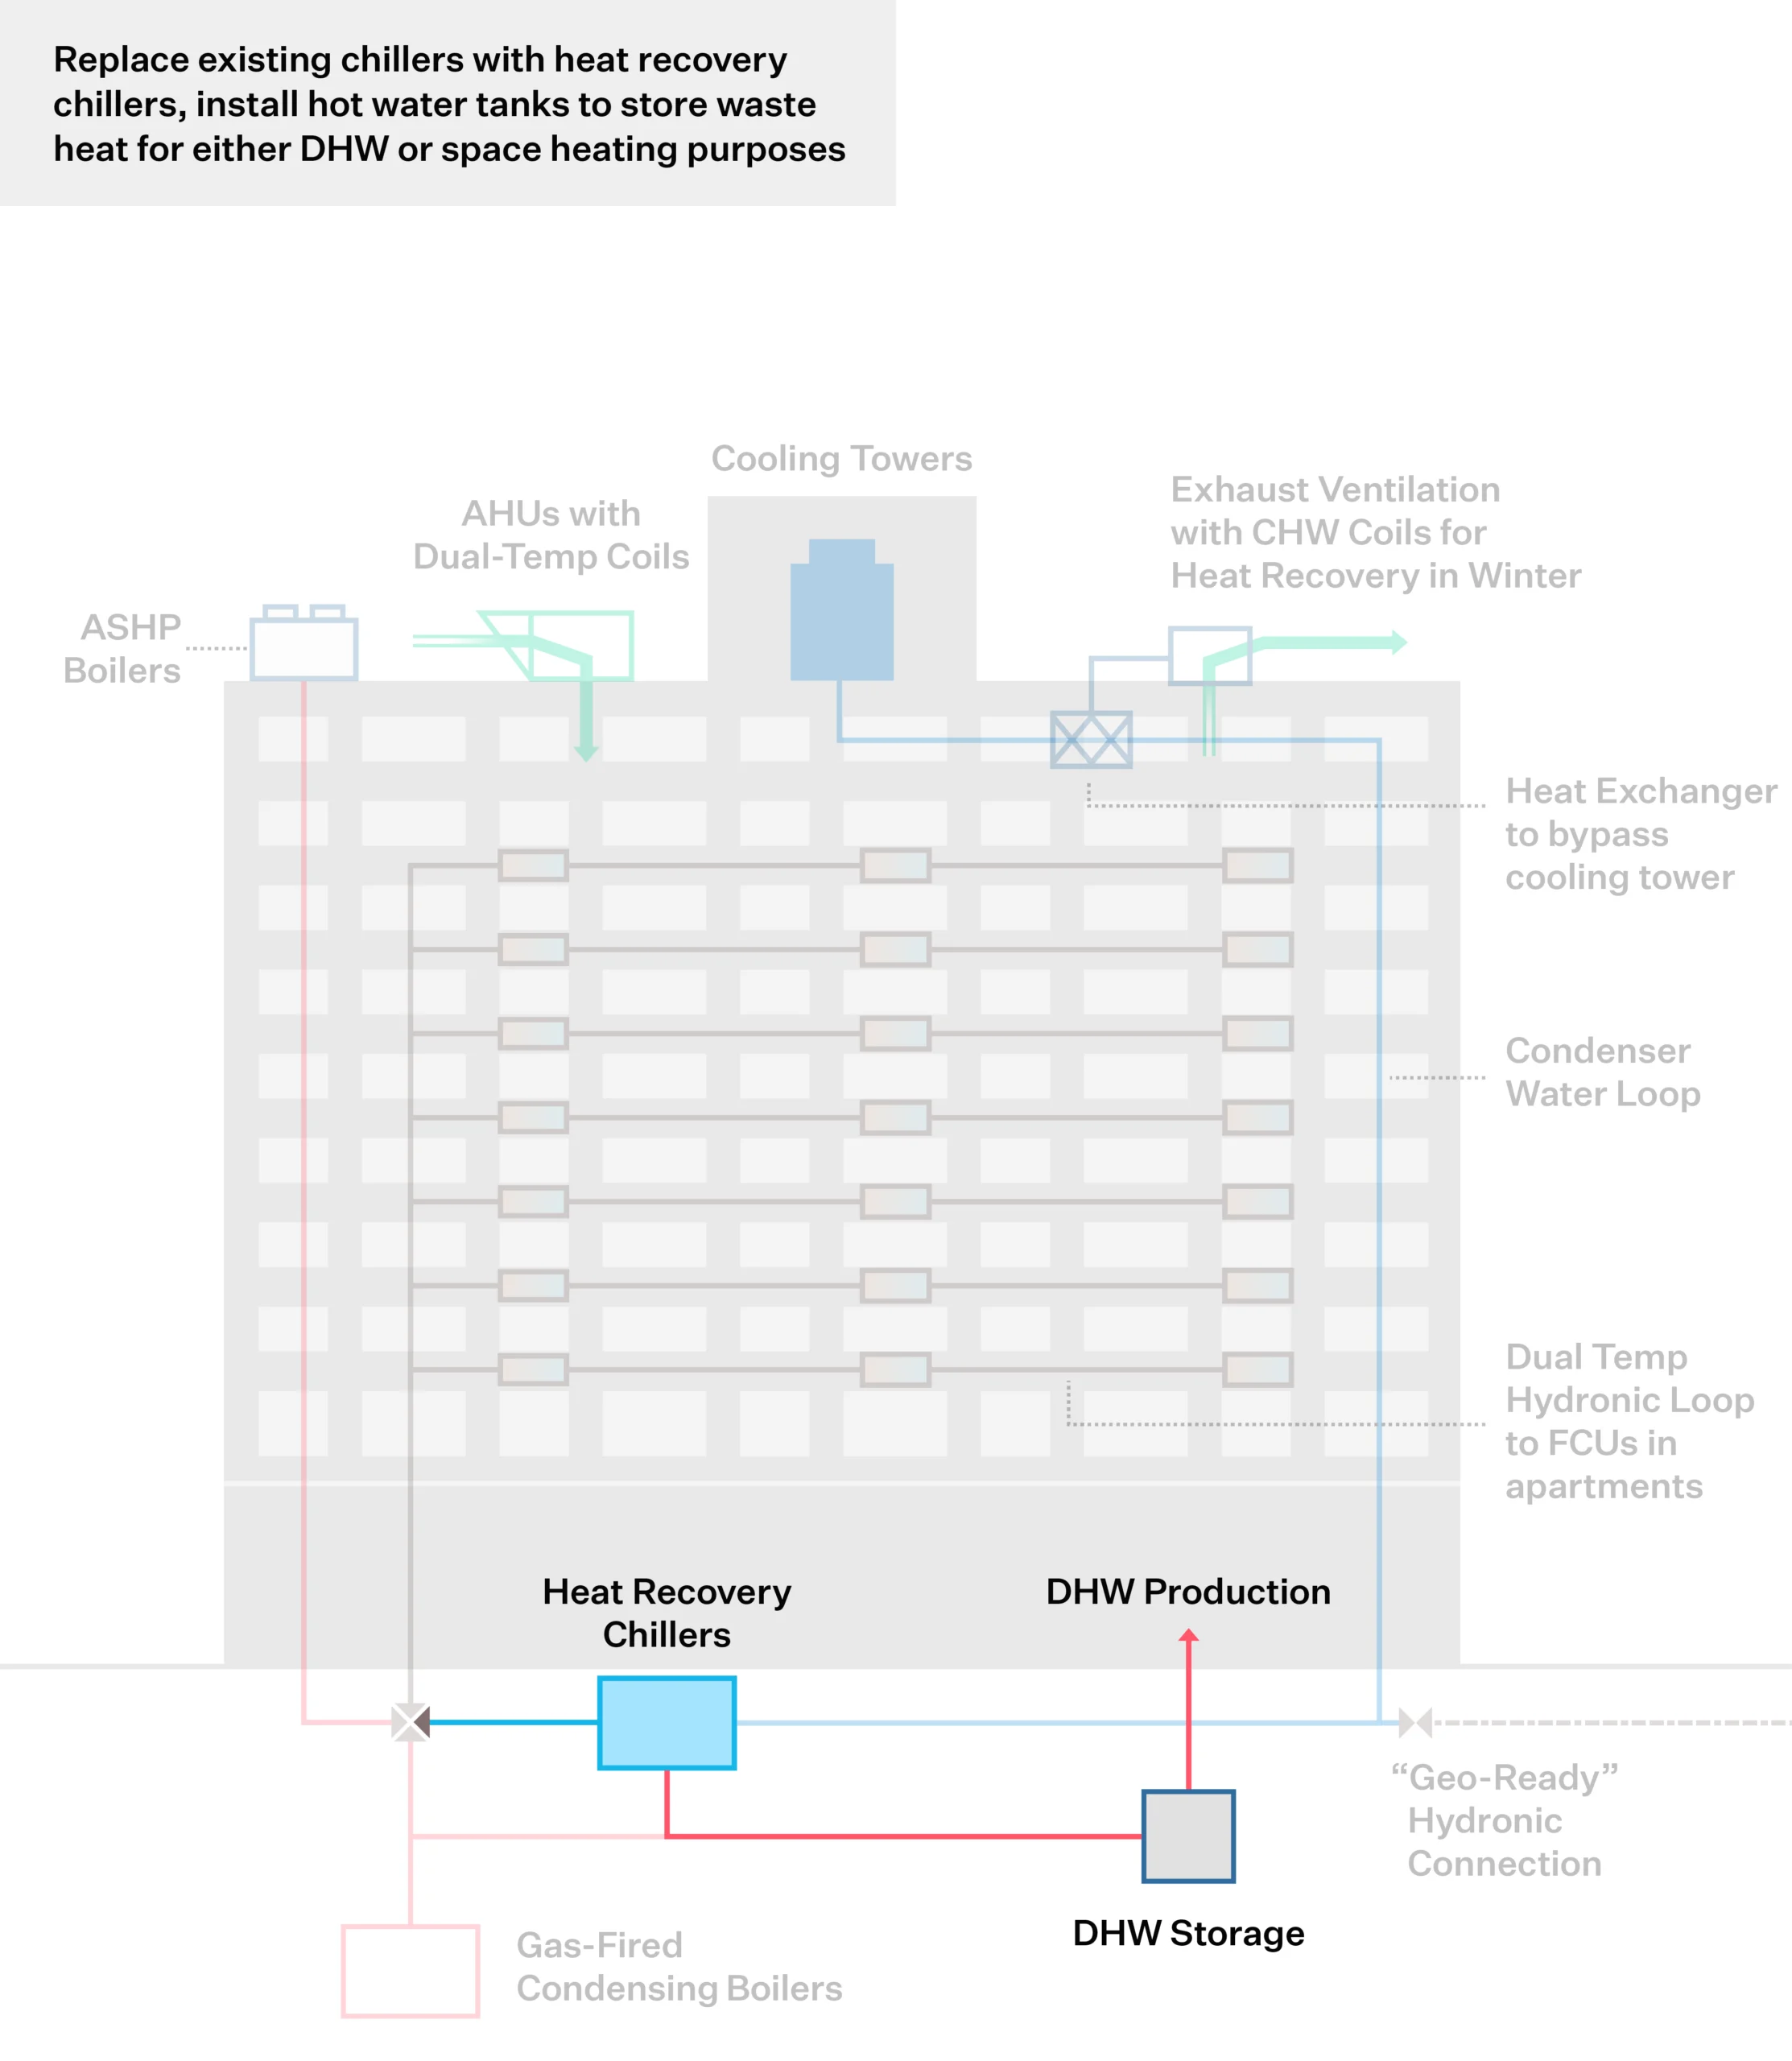
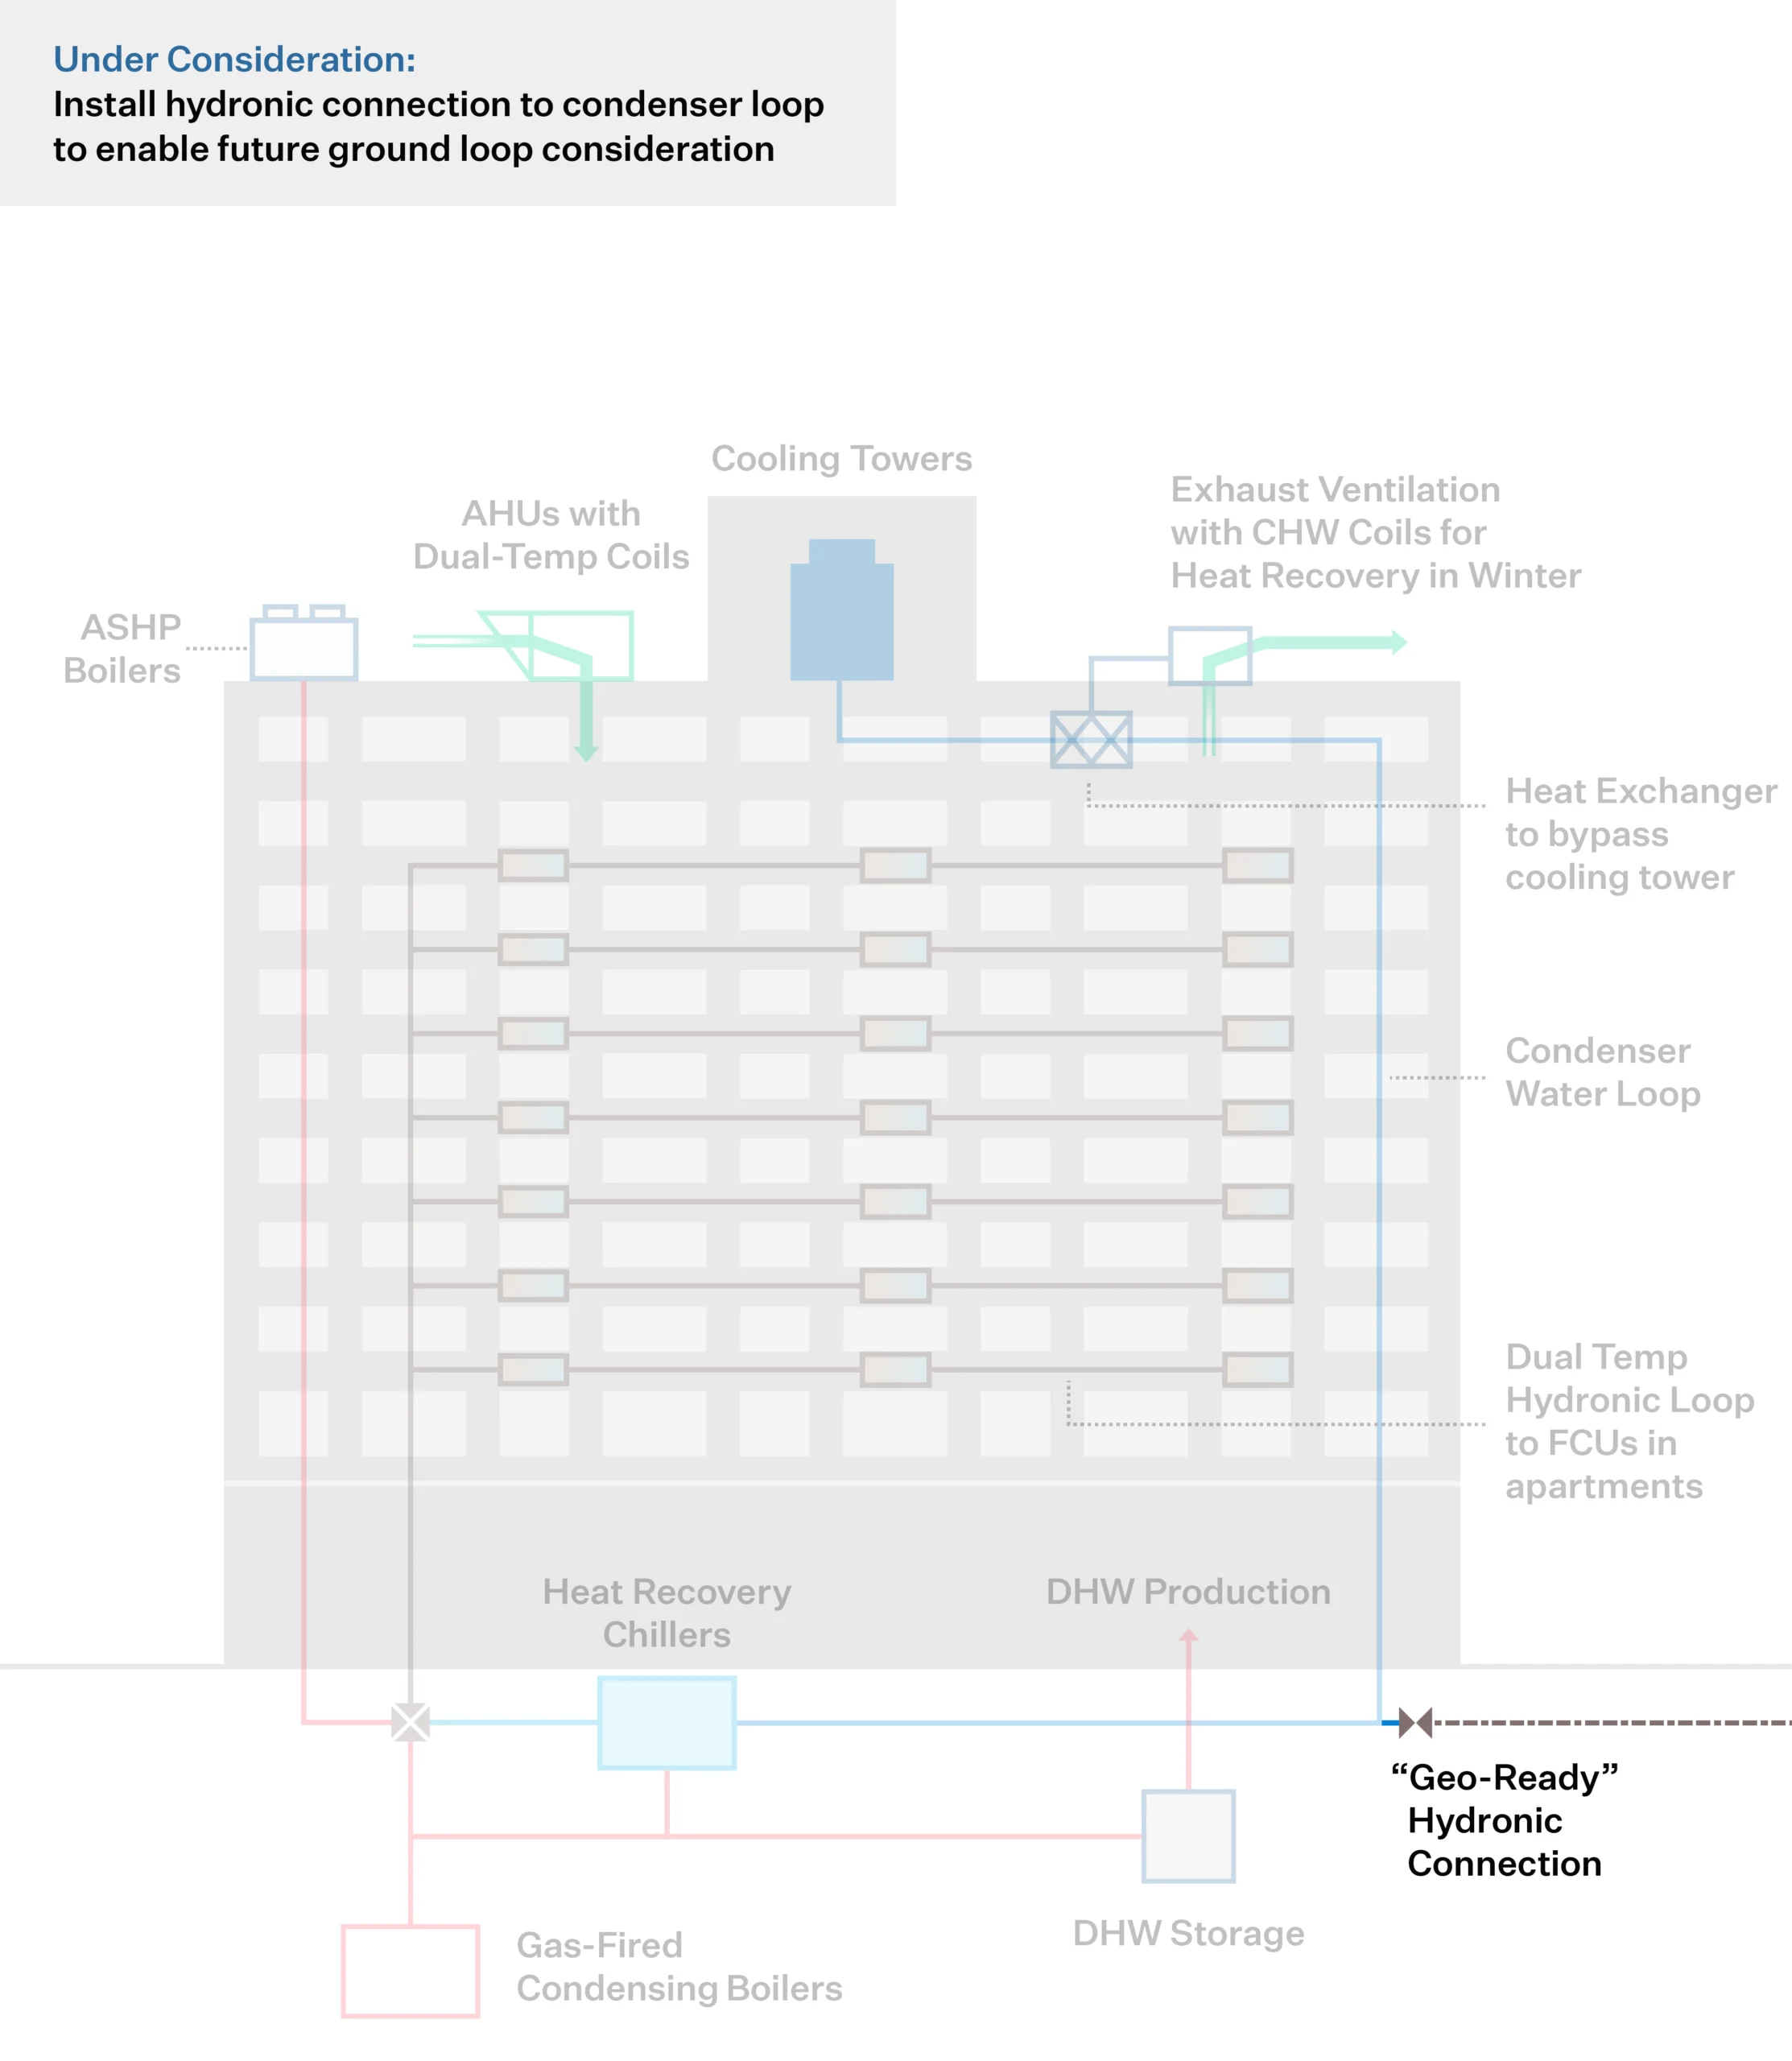
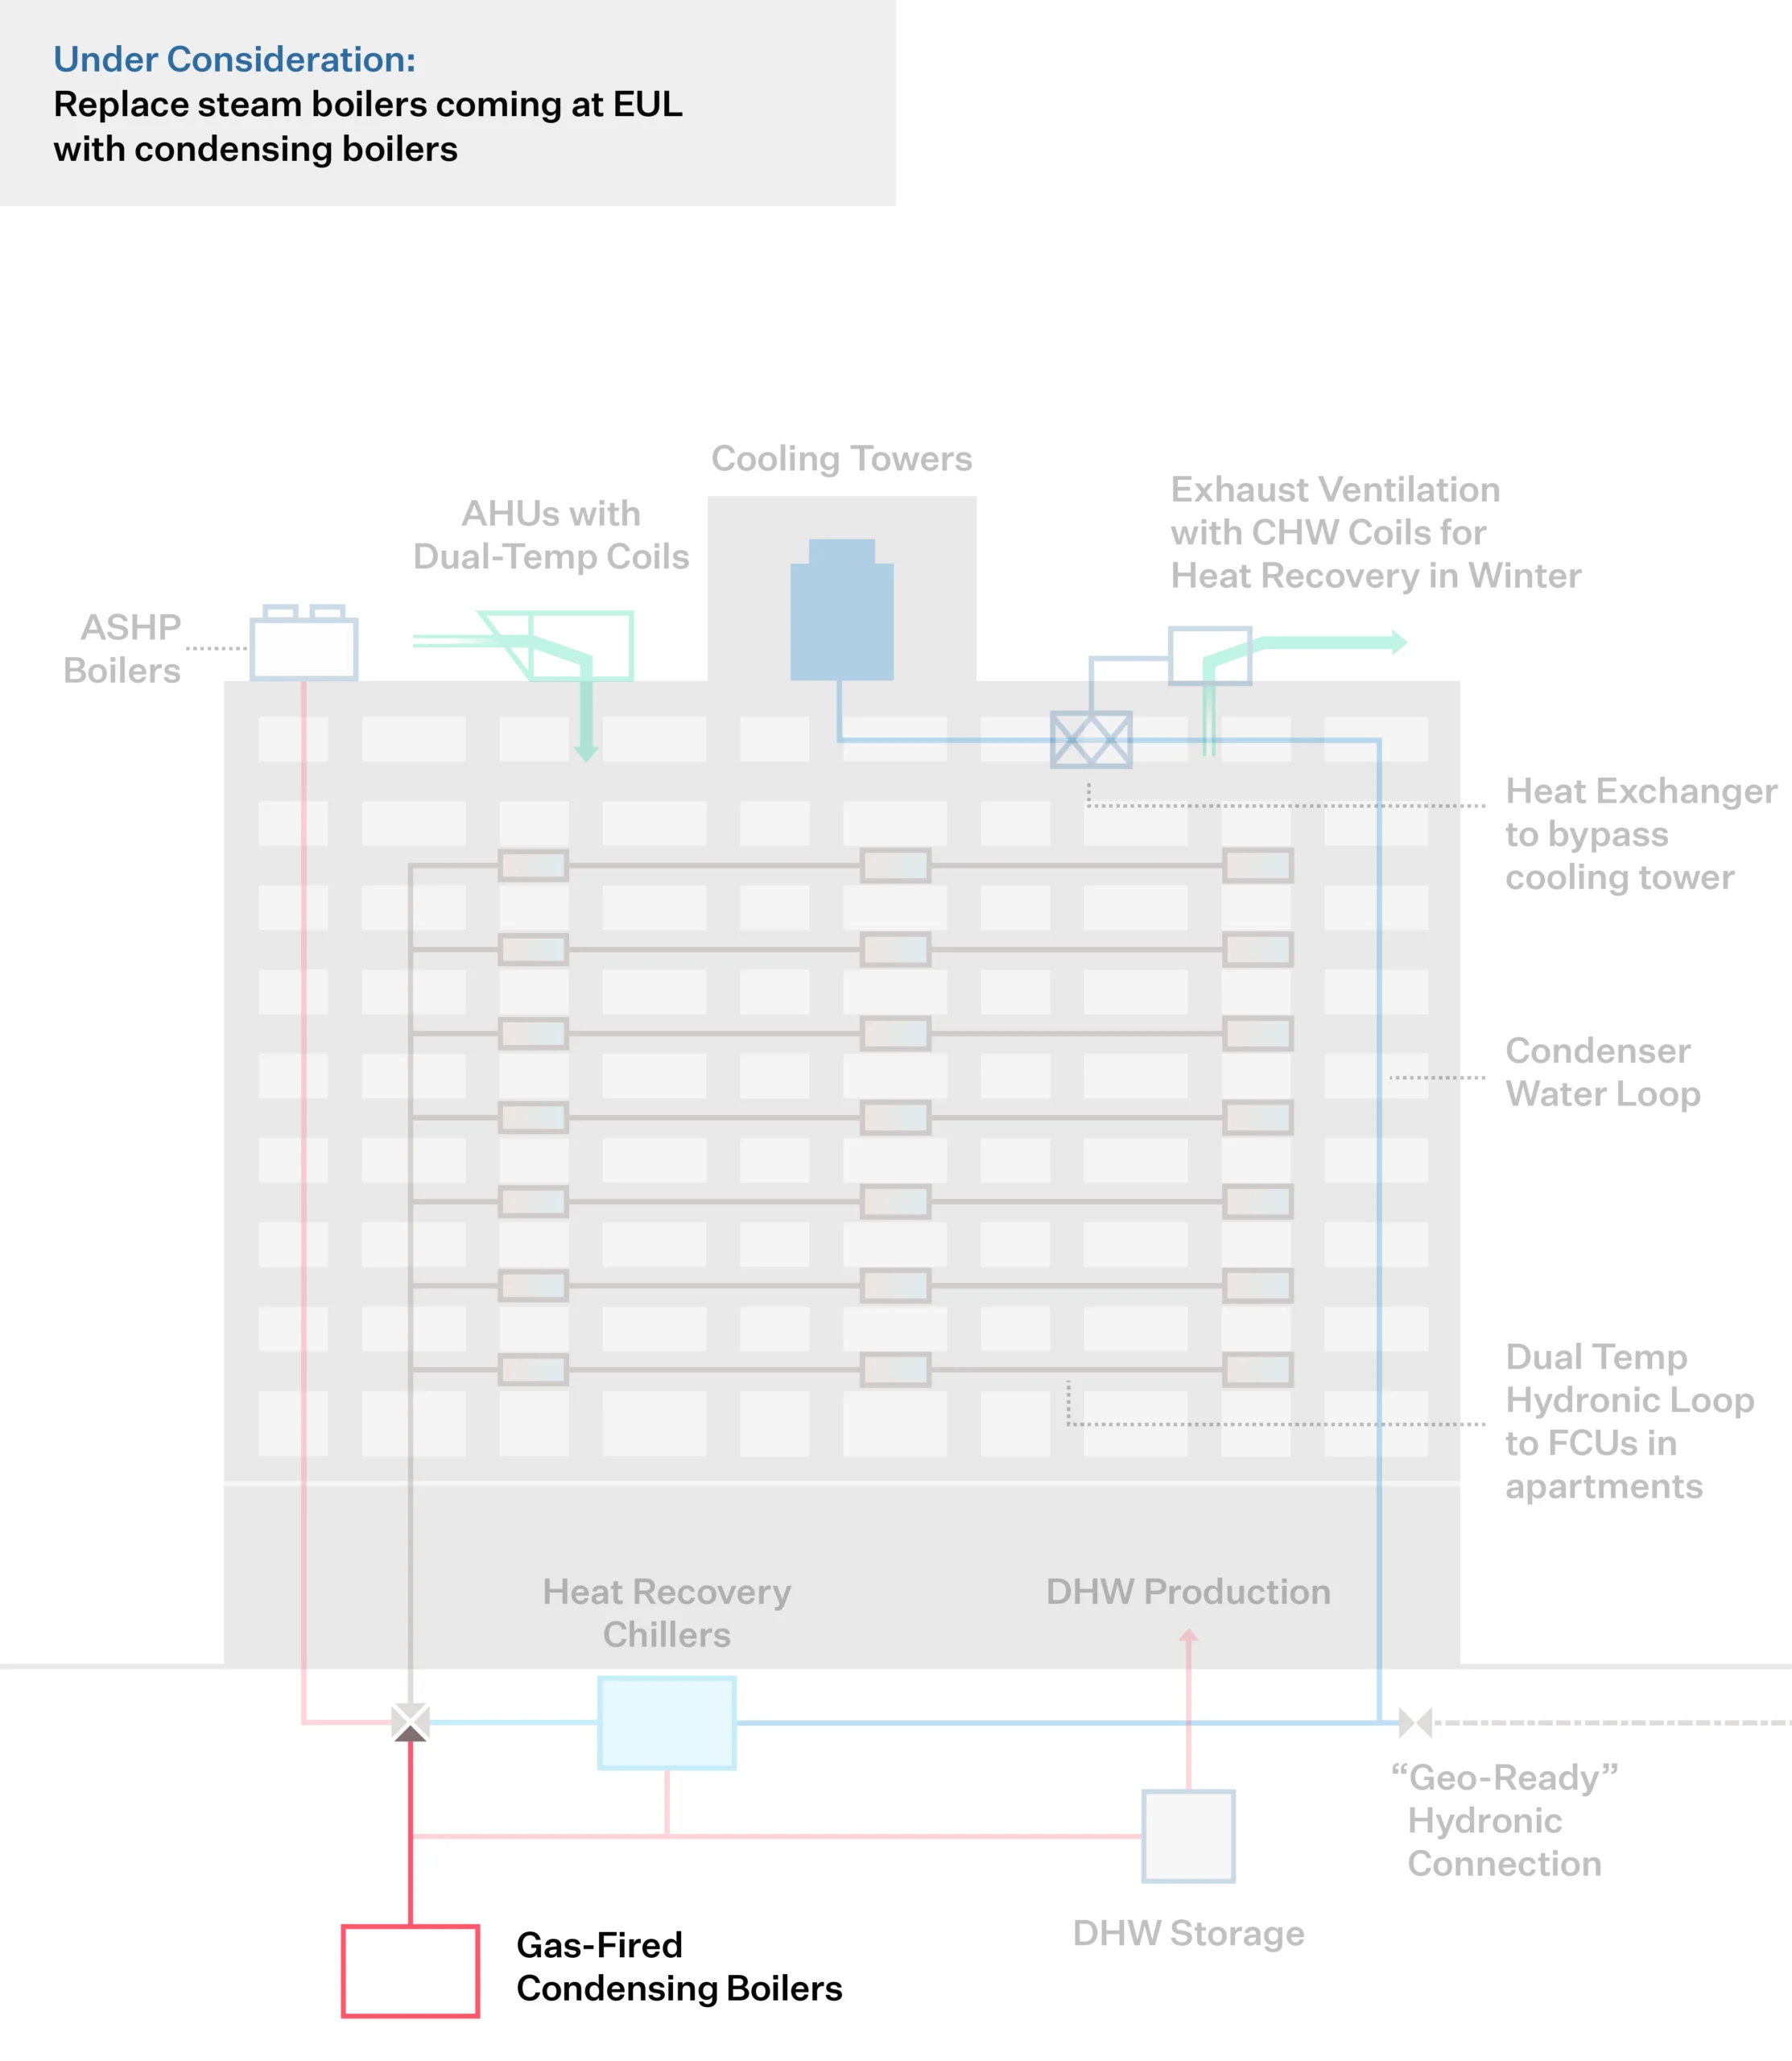
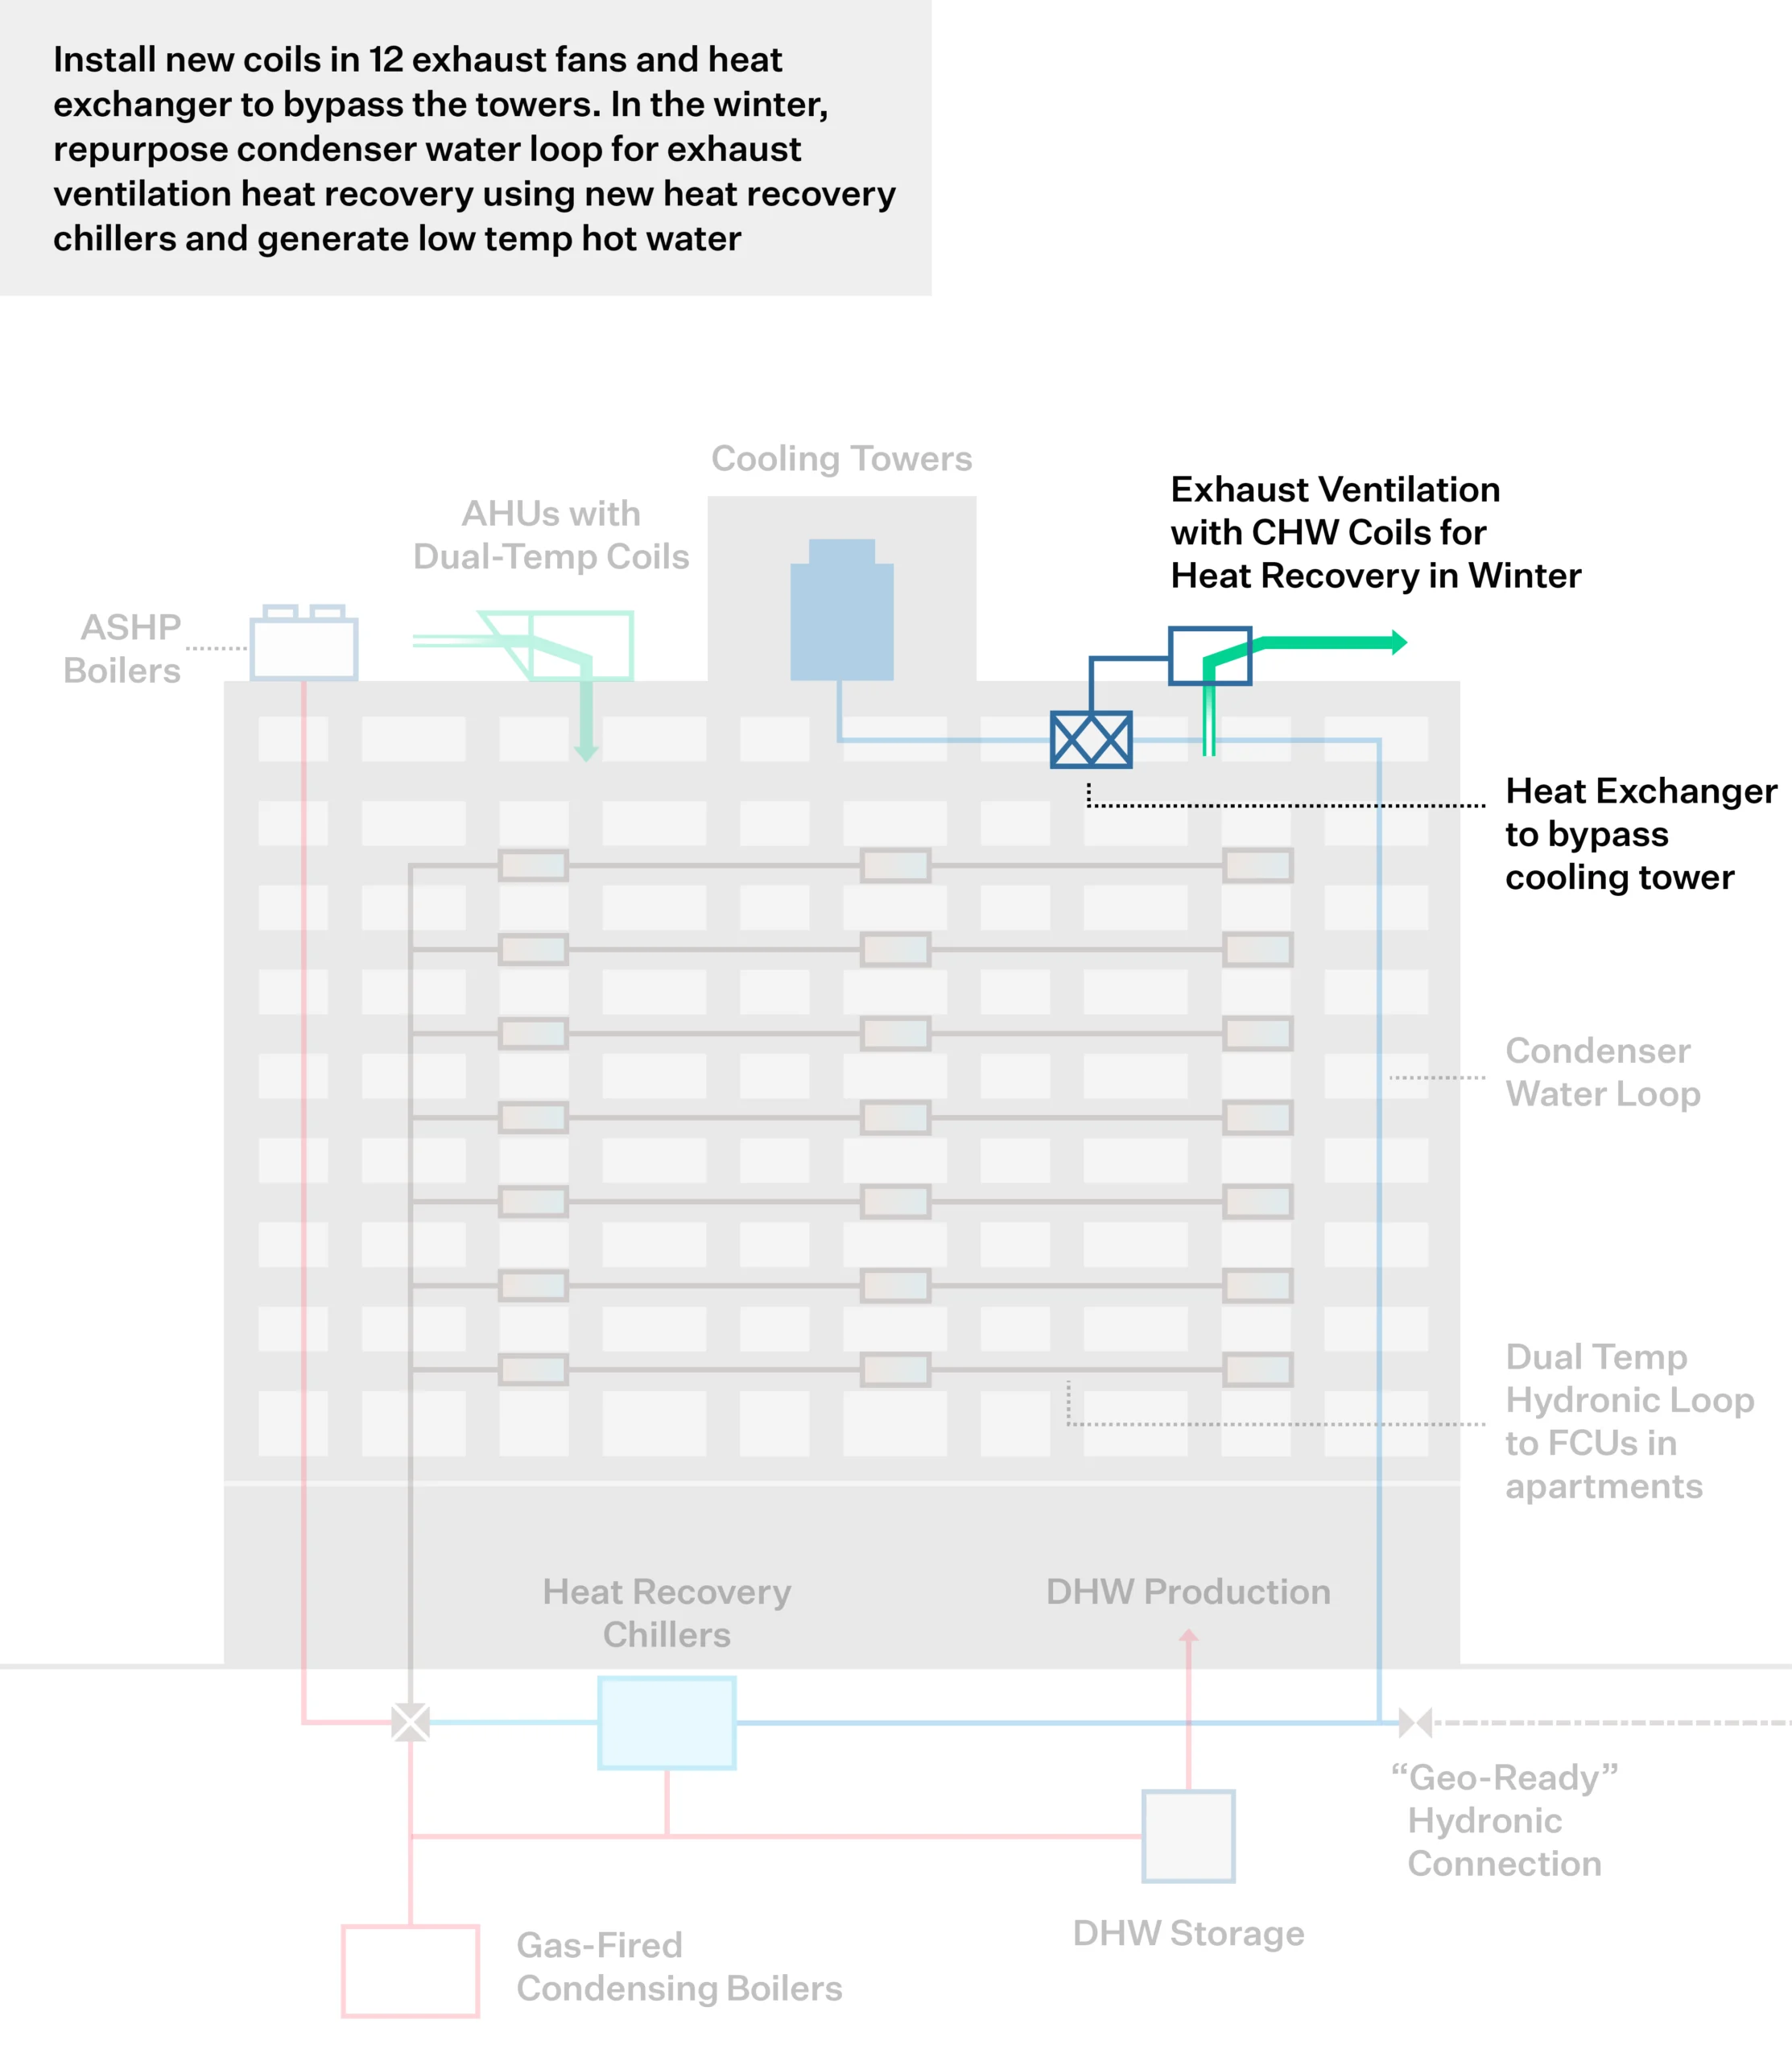
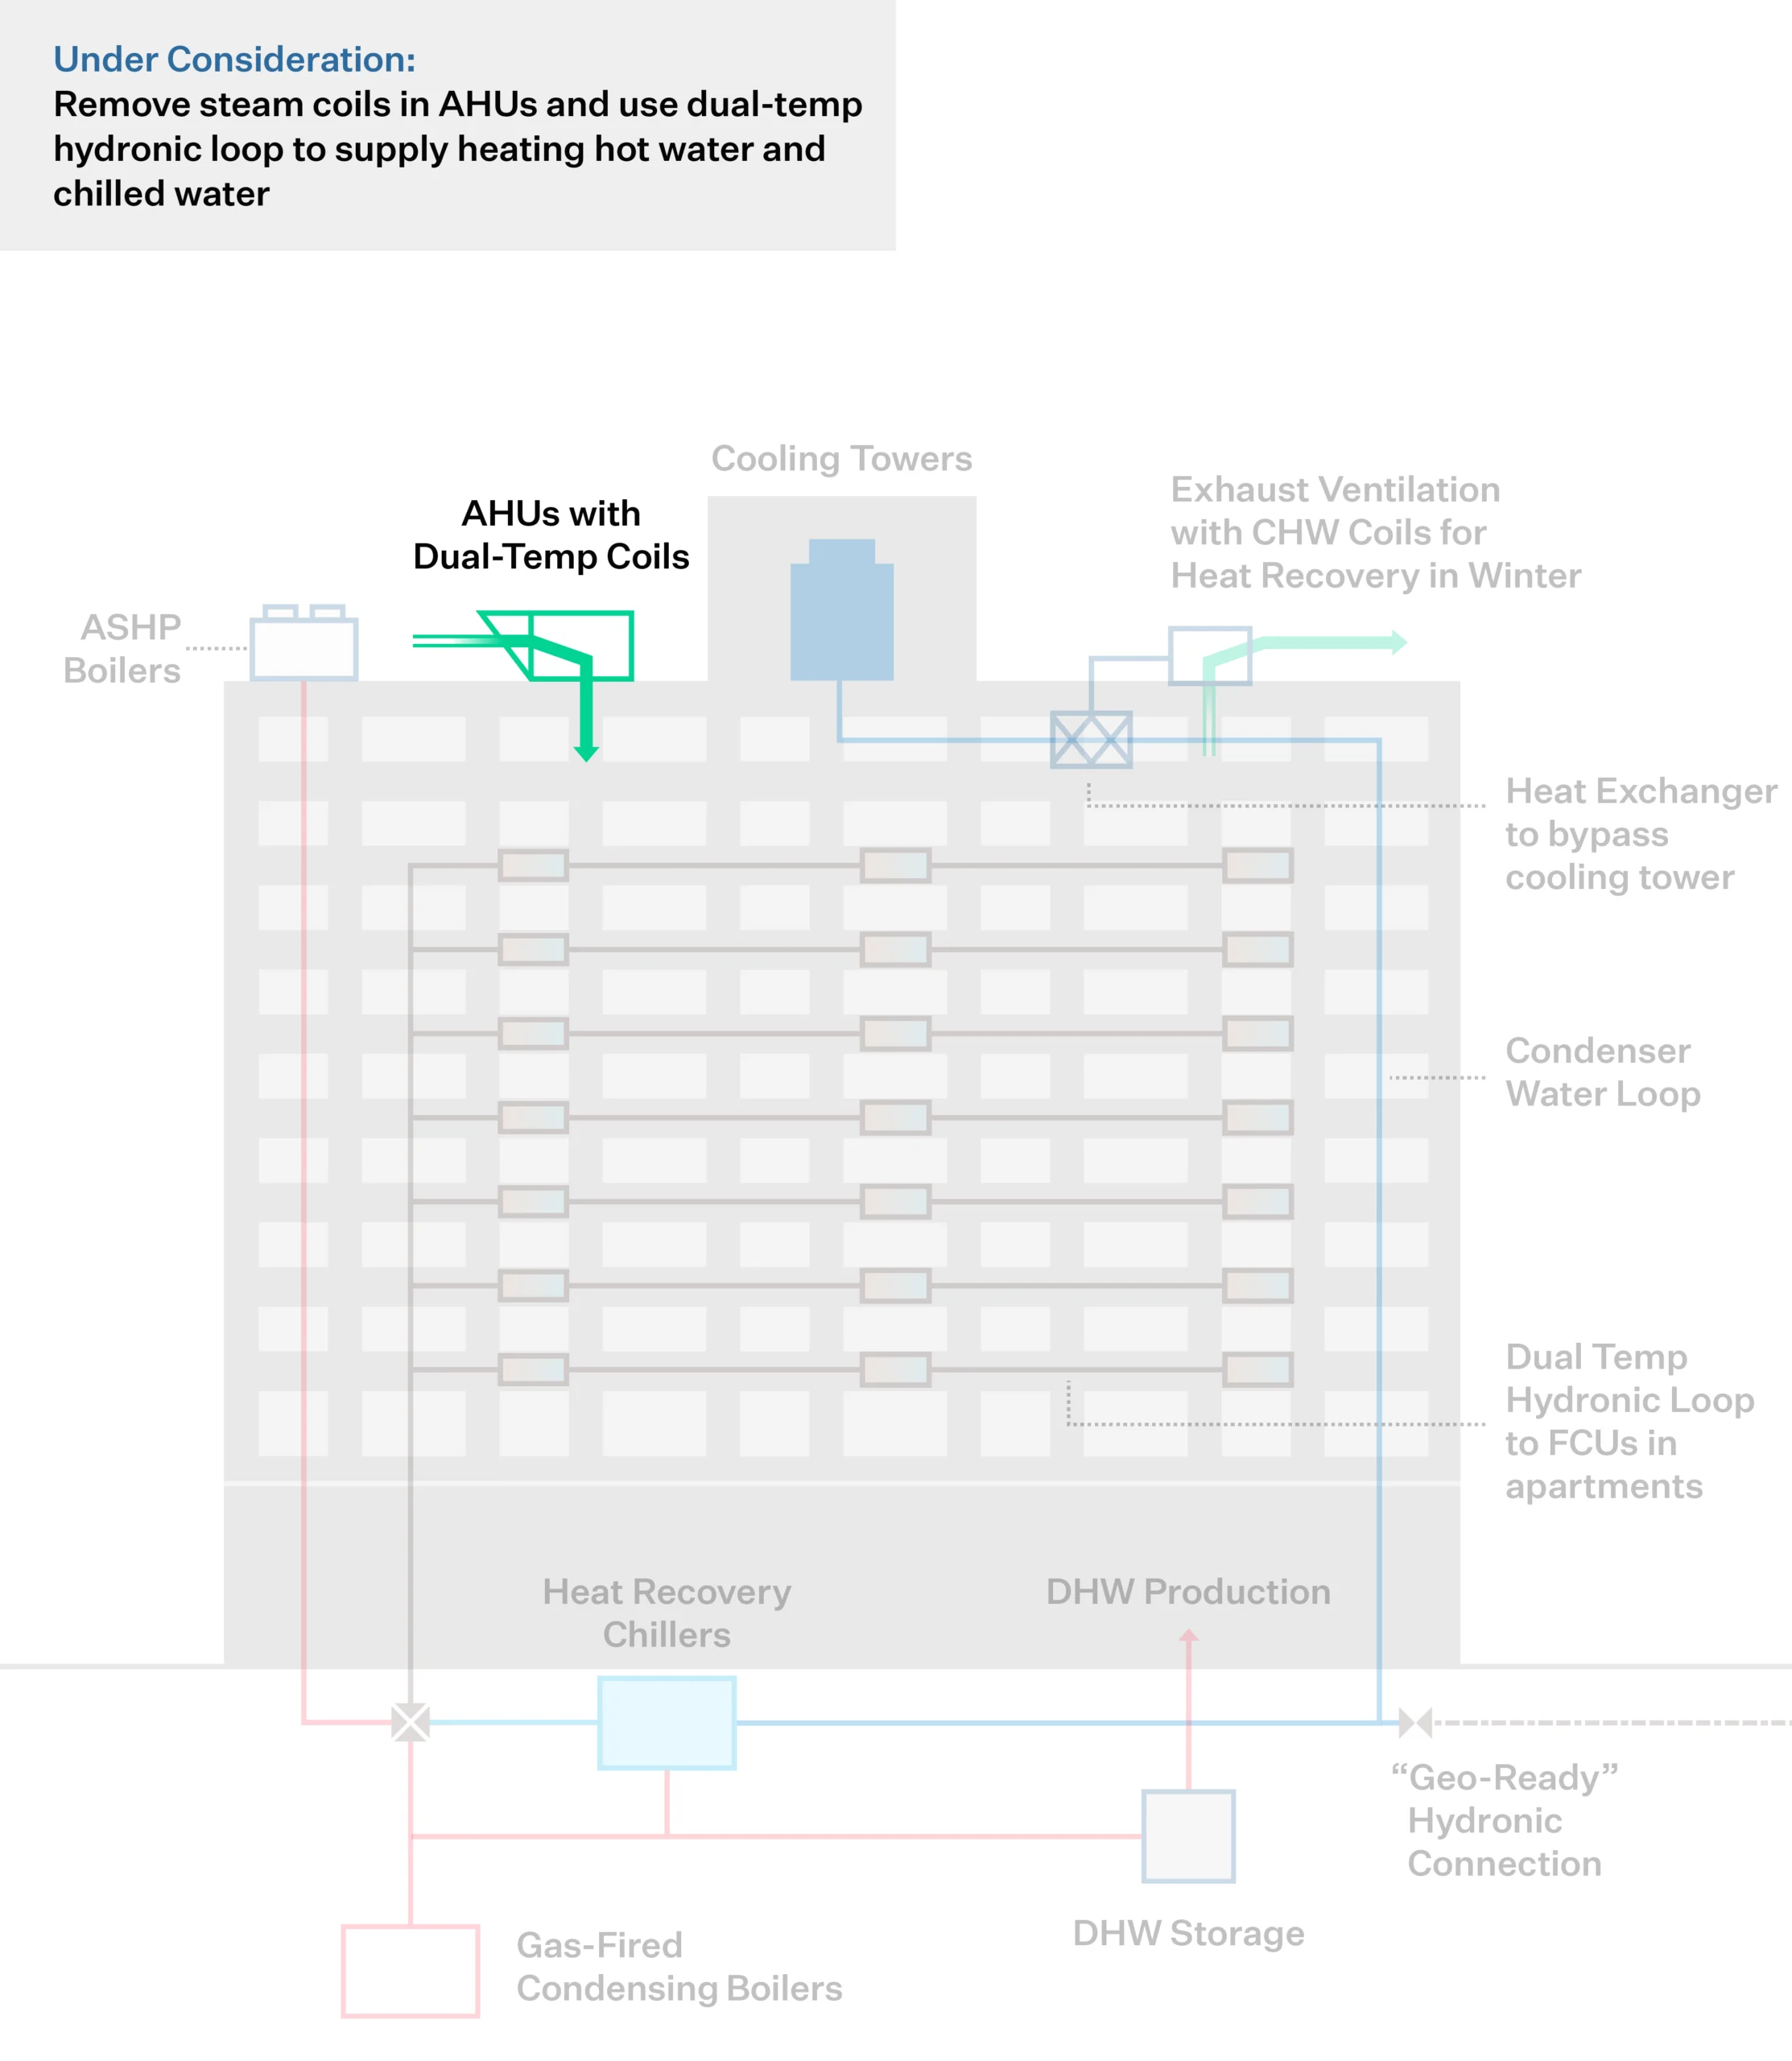
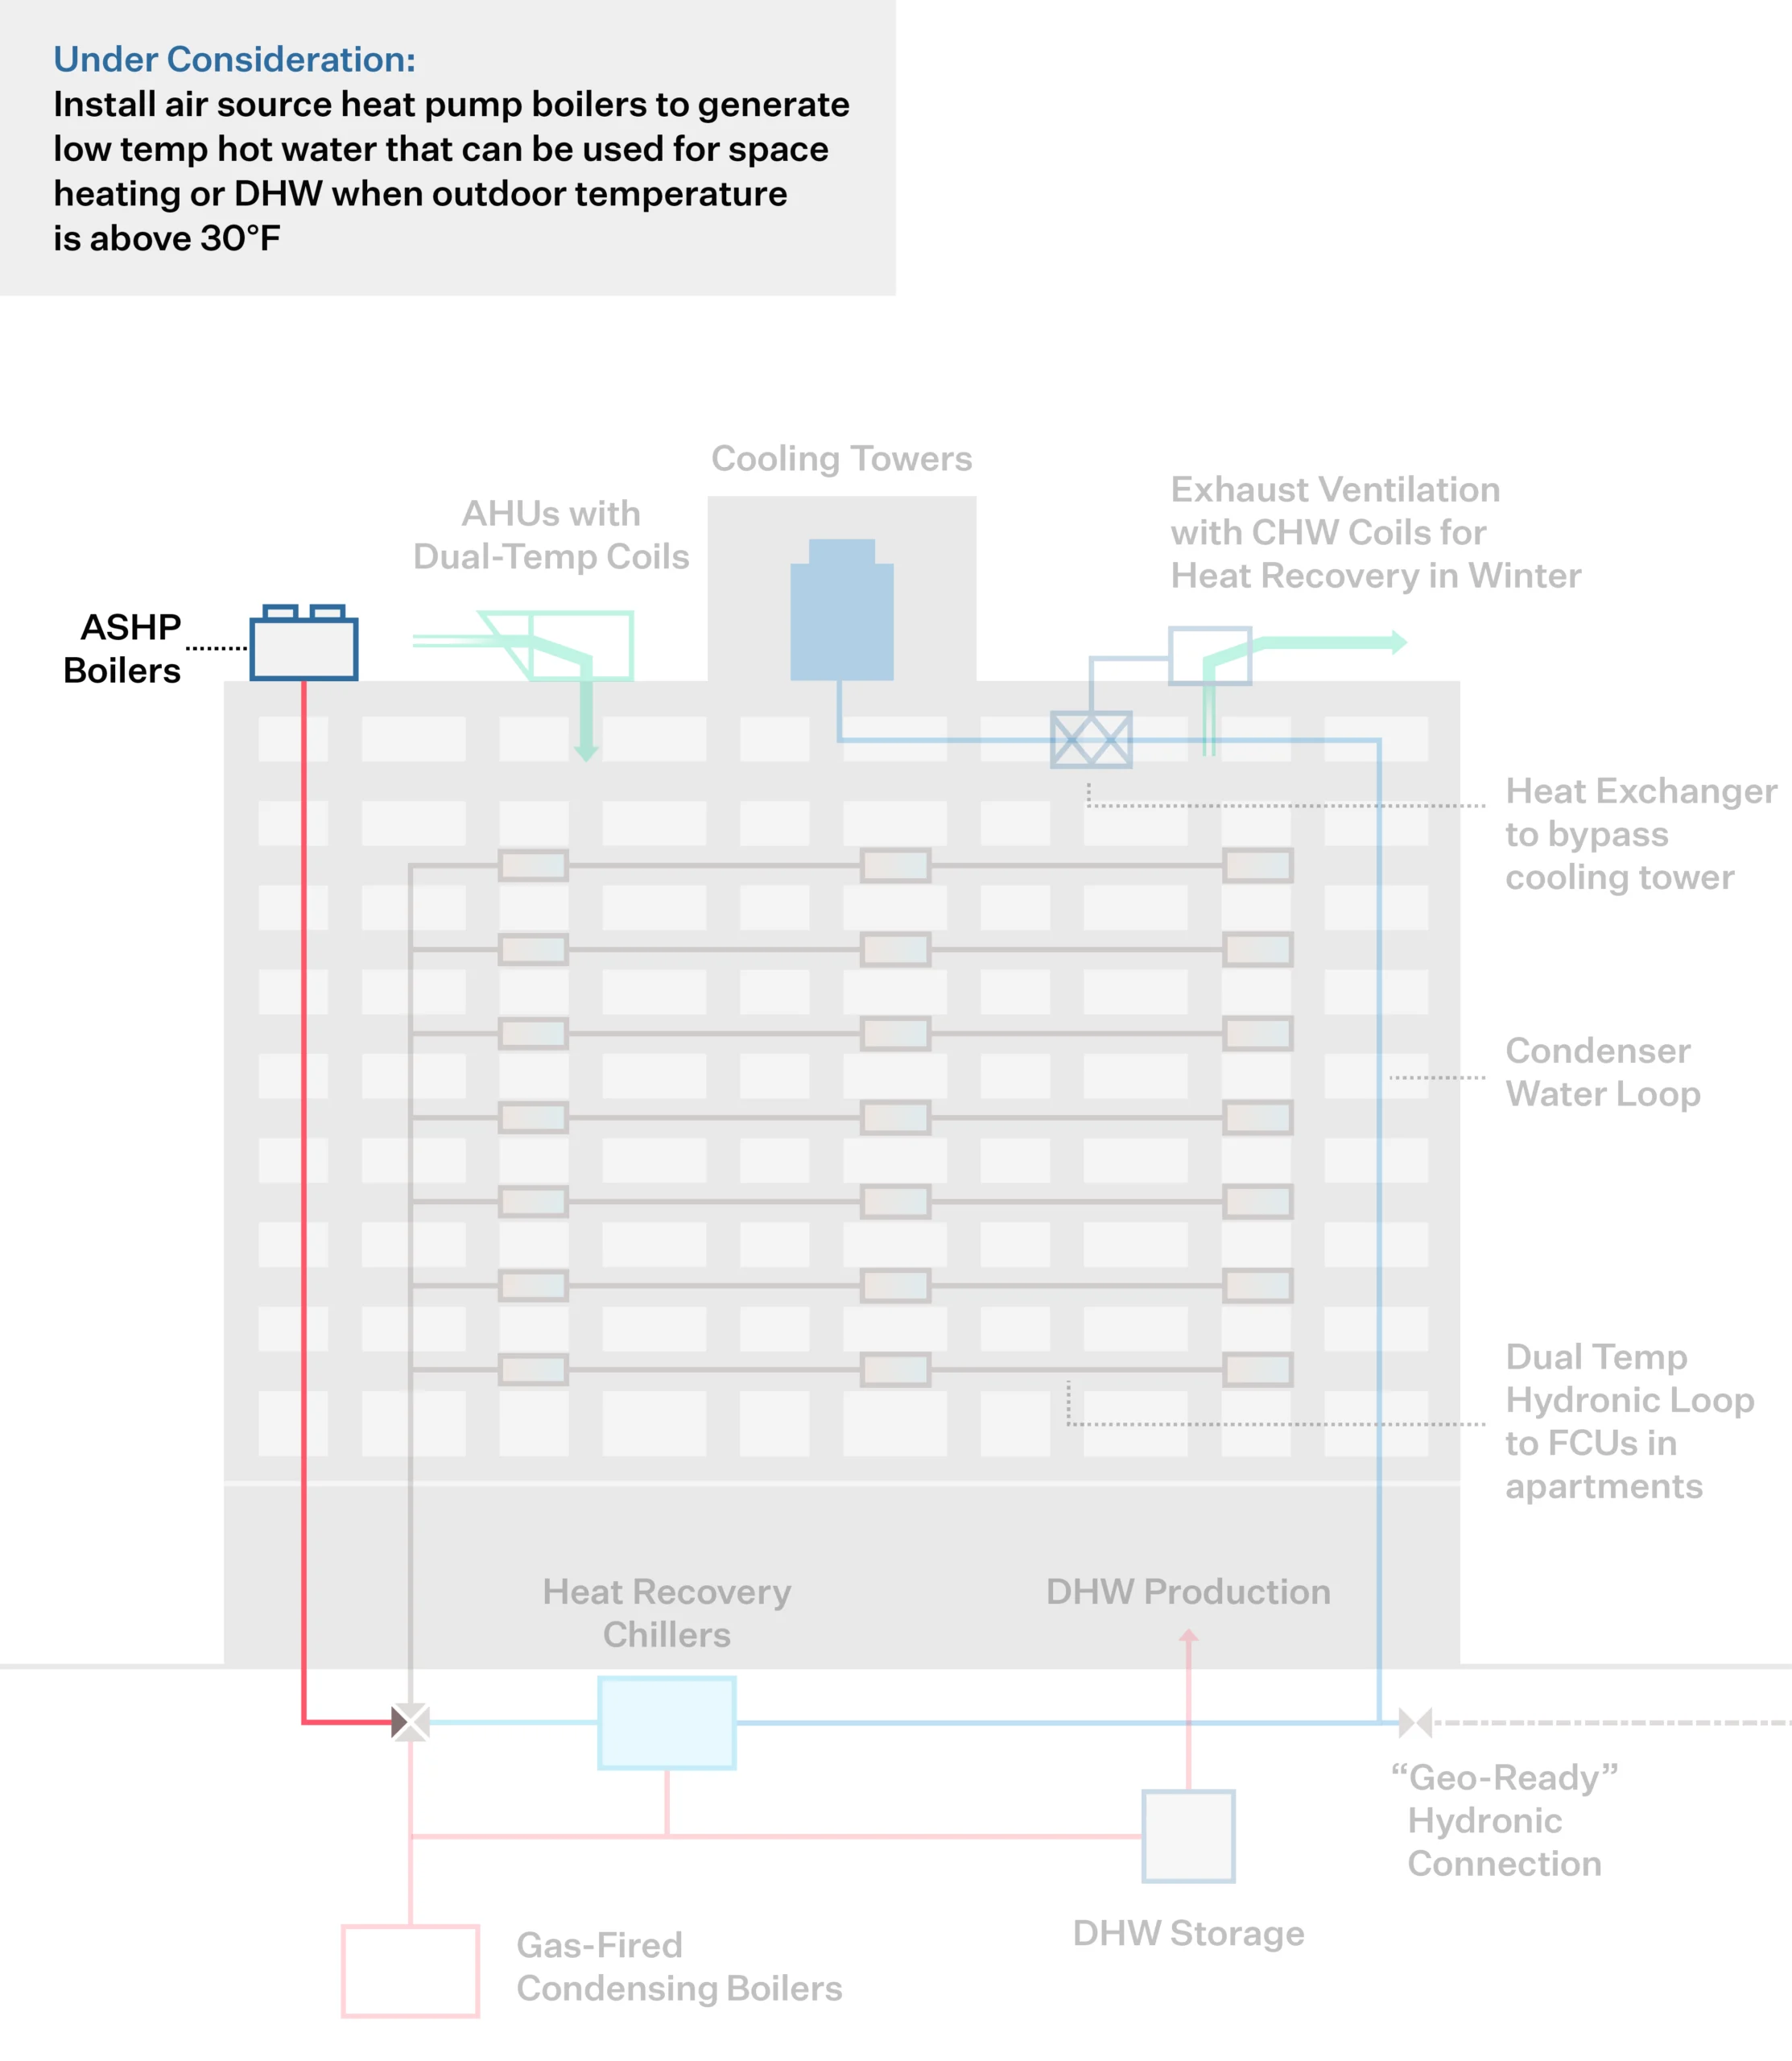
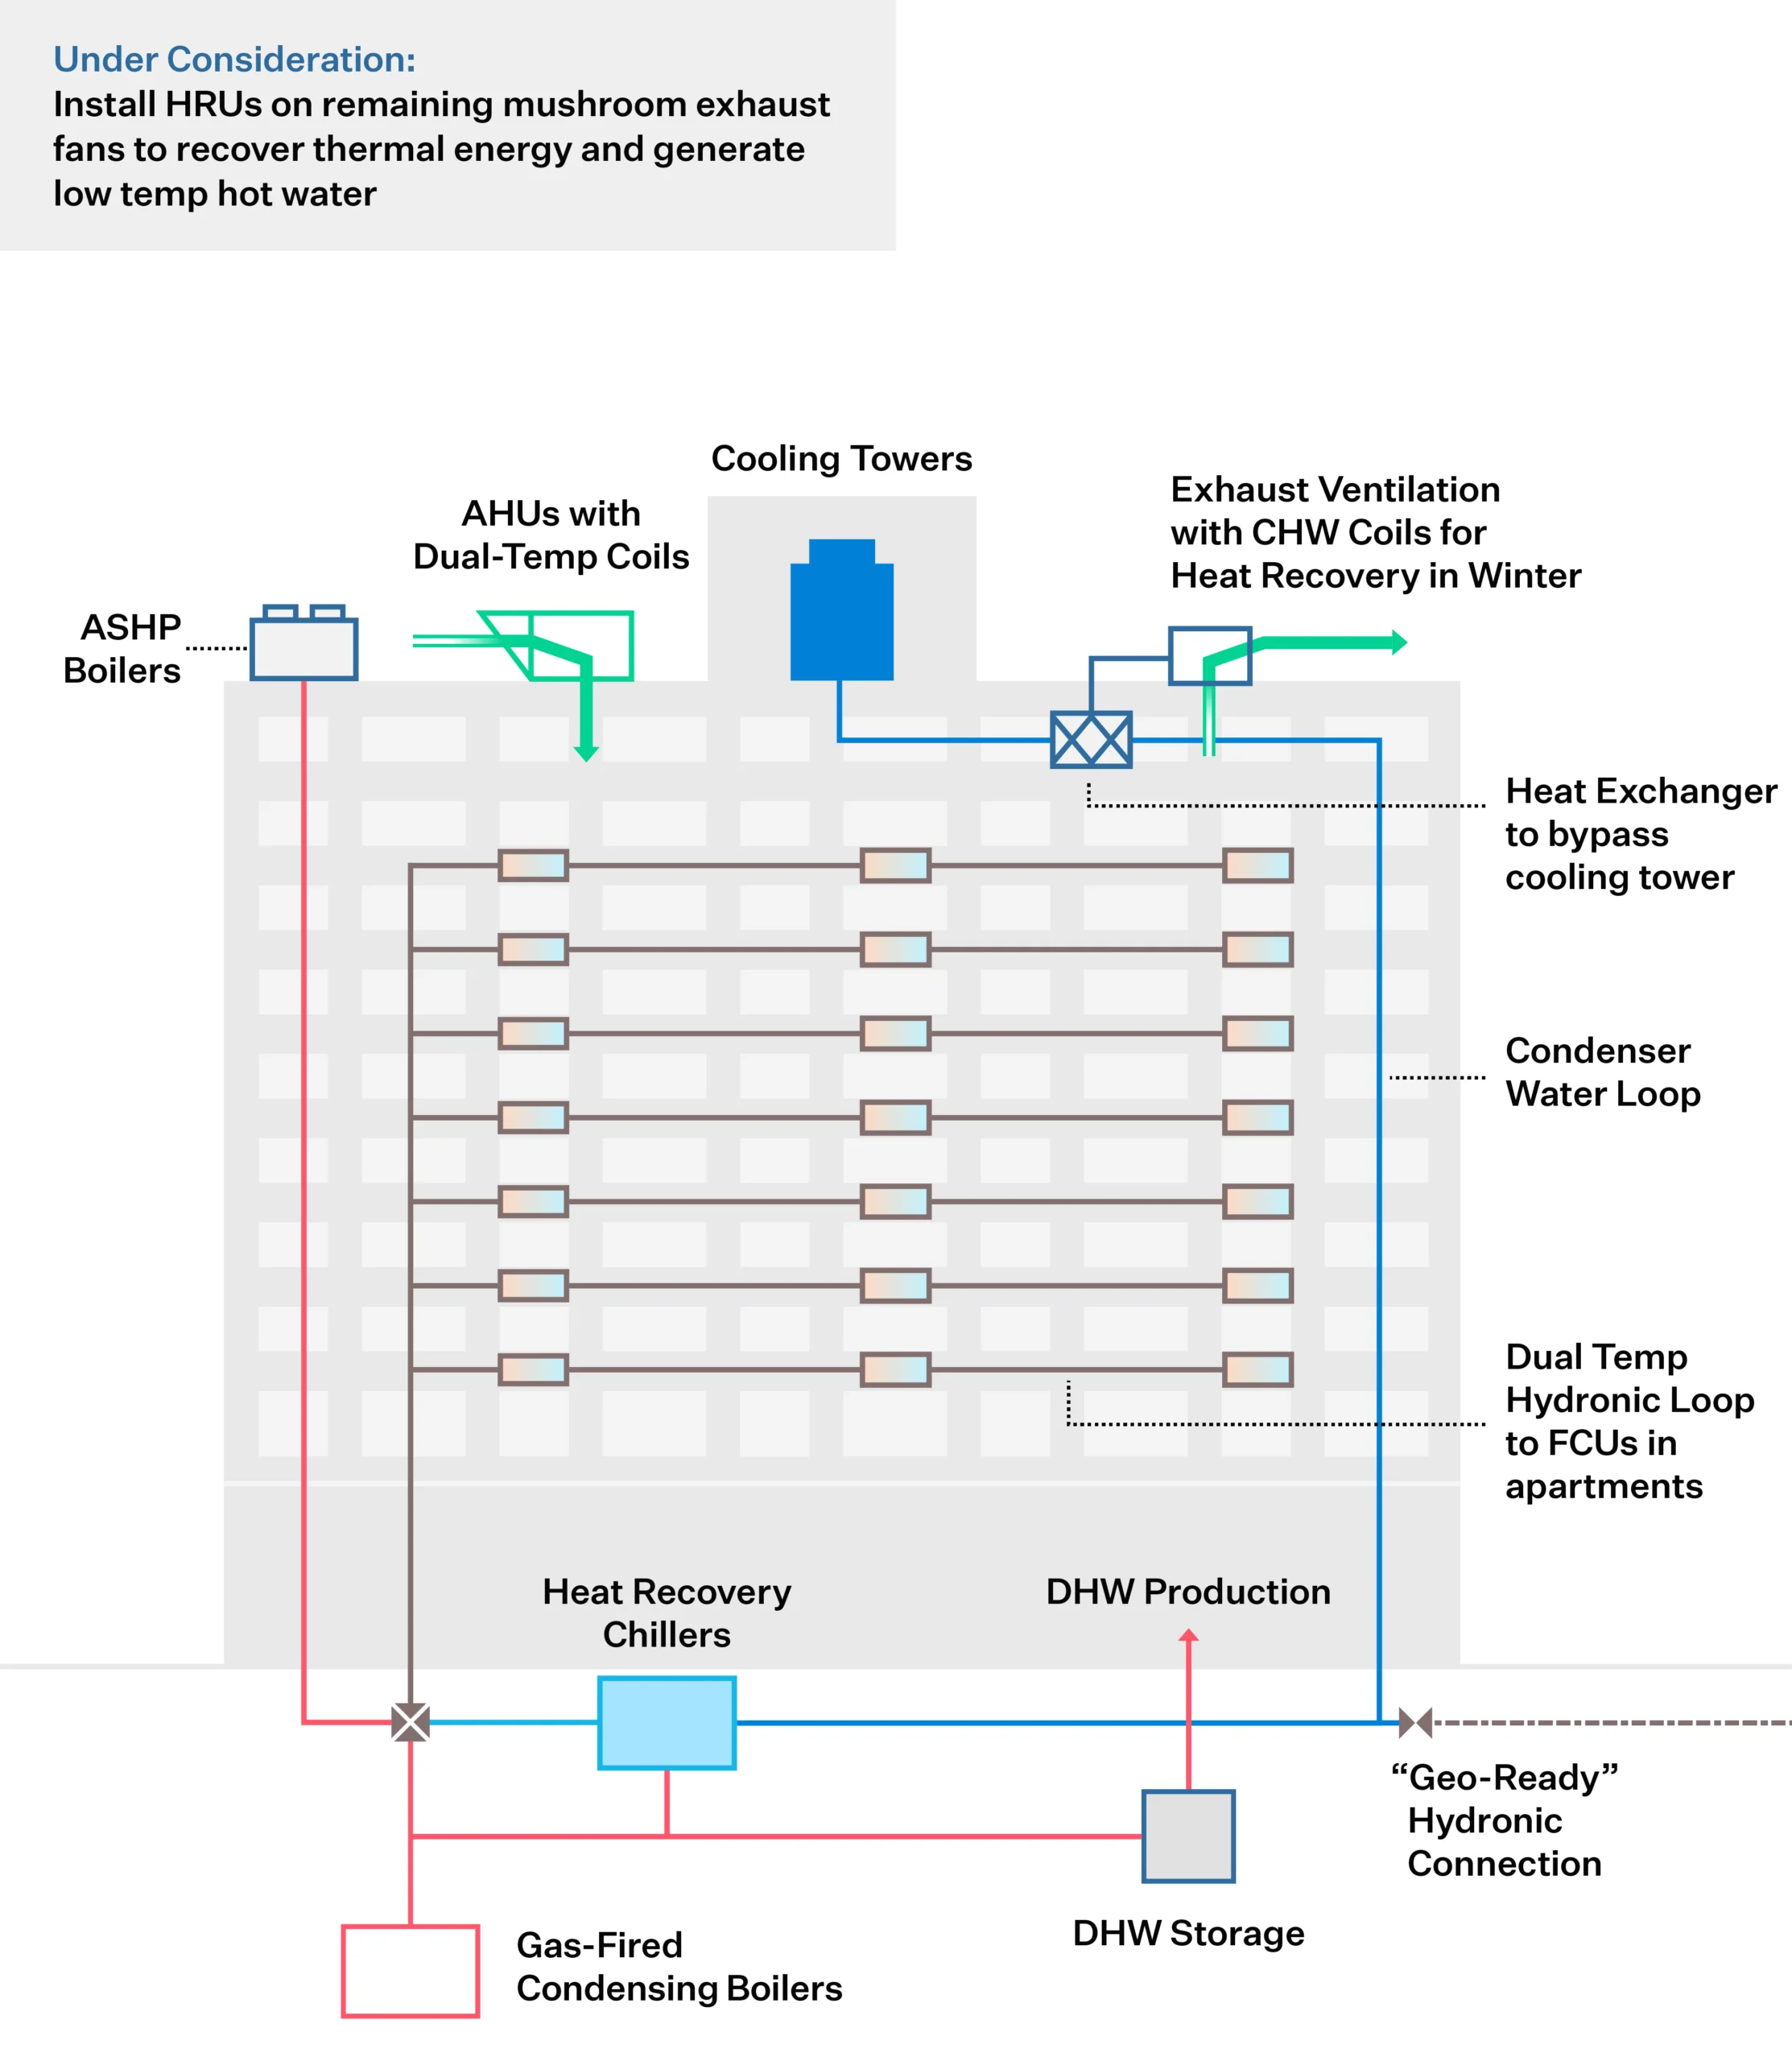
Effective engineering integrates measures for reducing energy load, recovering wasted heat, and moving towards partial or full electrification. This increases operational efficiencies, optimizes energy peaks, and avoids oversized heating systems, thus alleviating space constraints and minimizing the cost of retrofits to decarbonize the building over time.
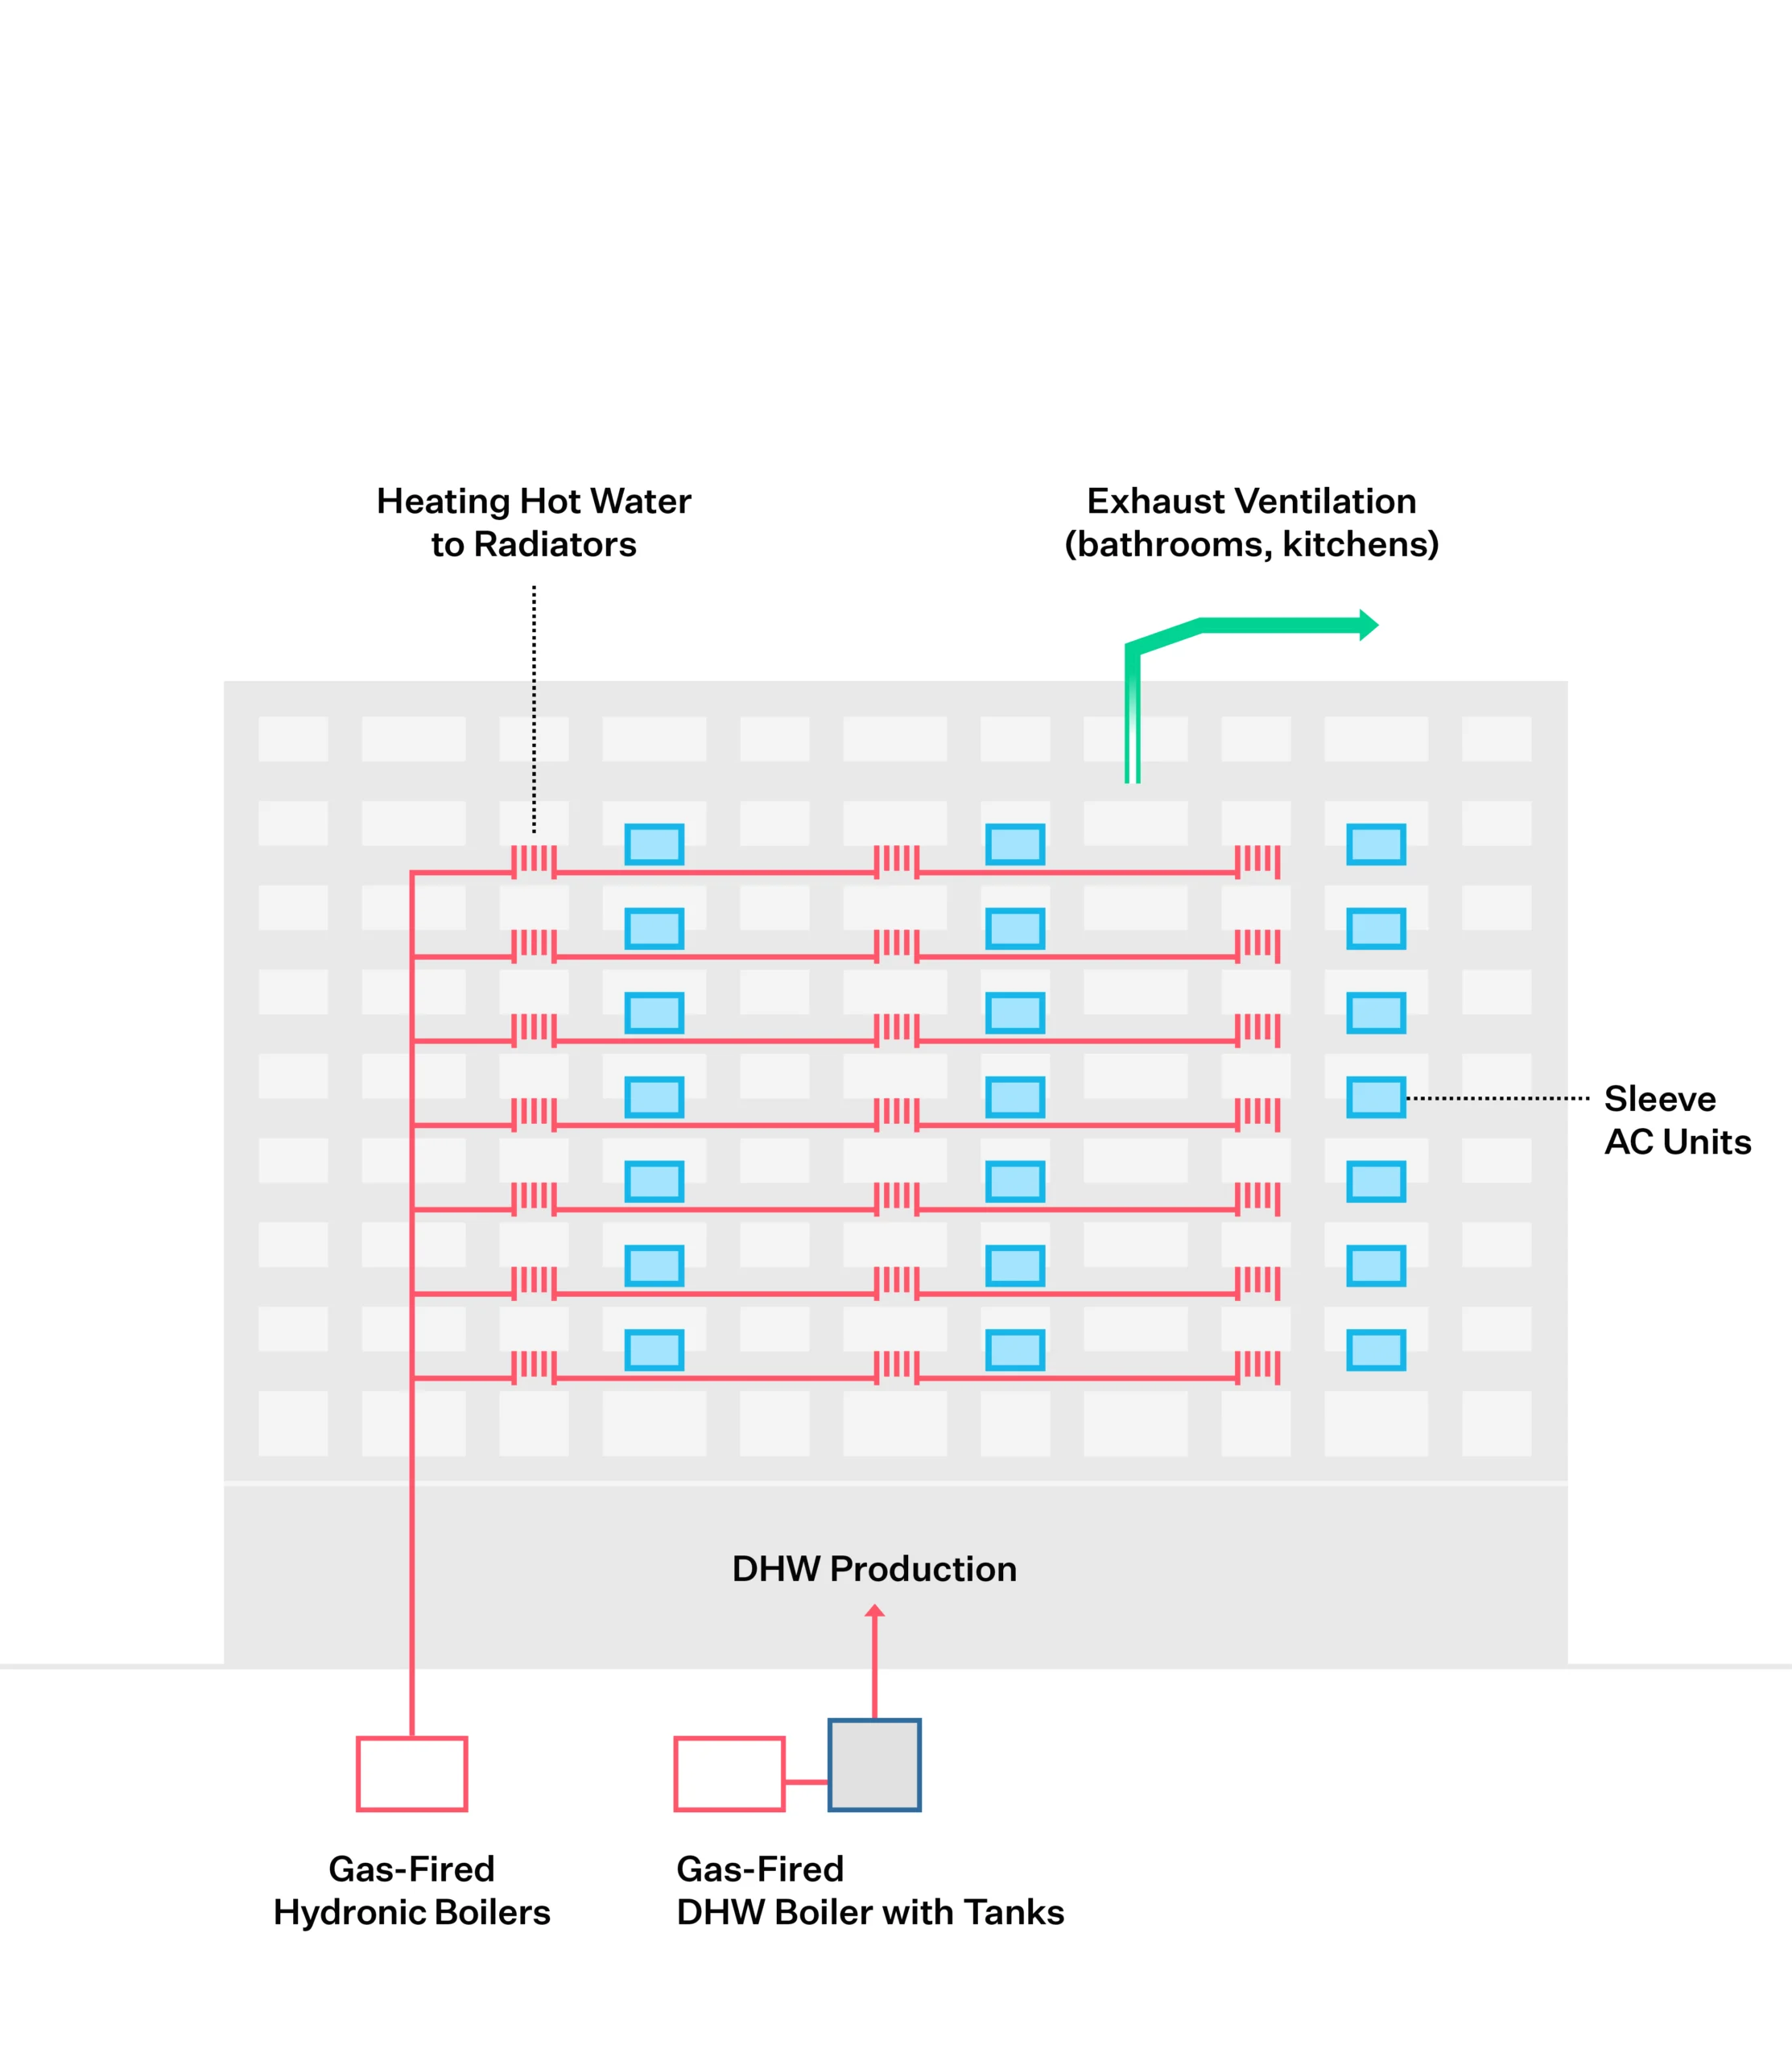
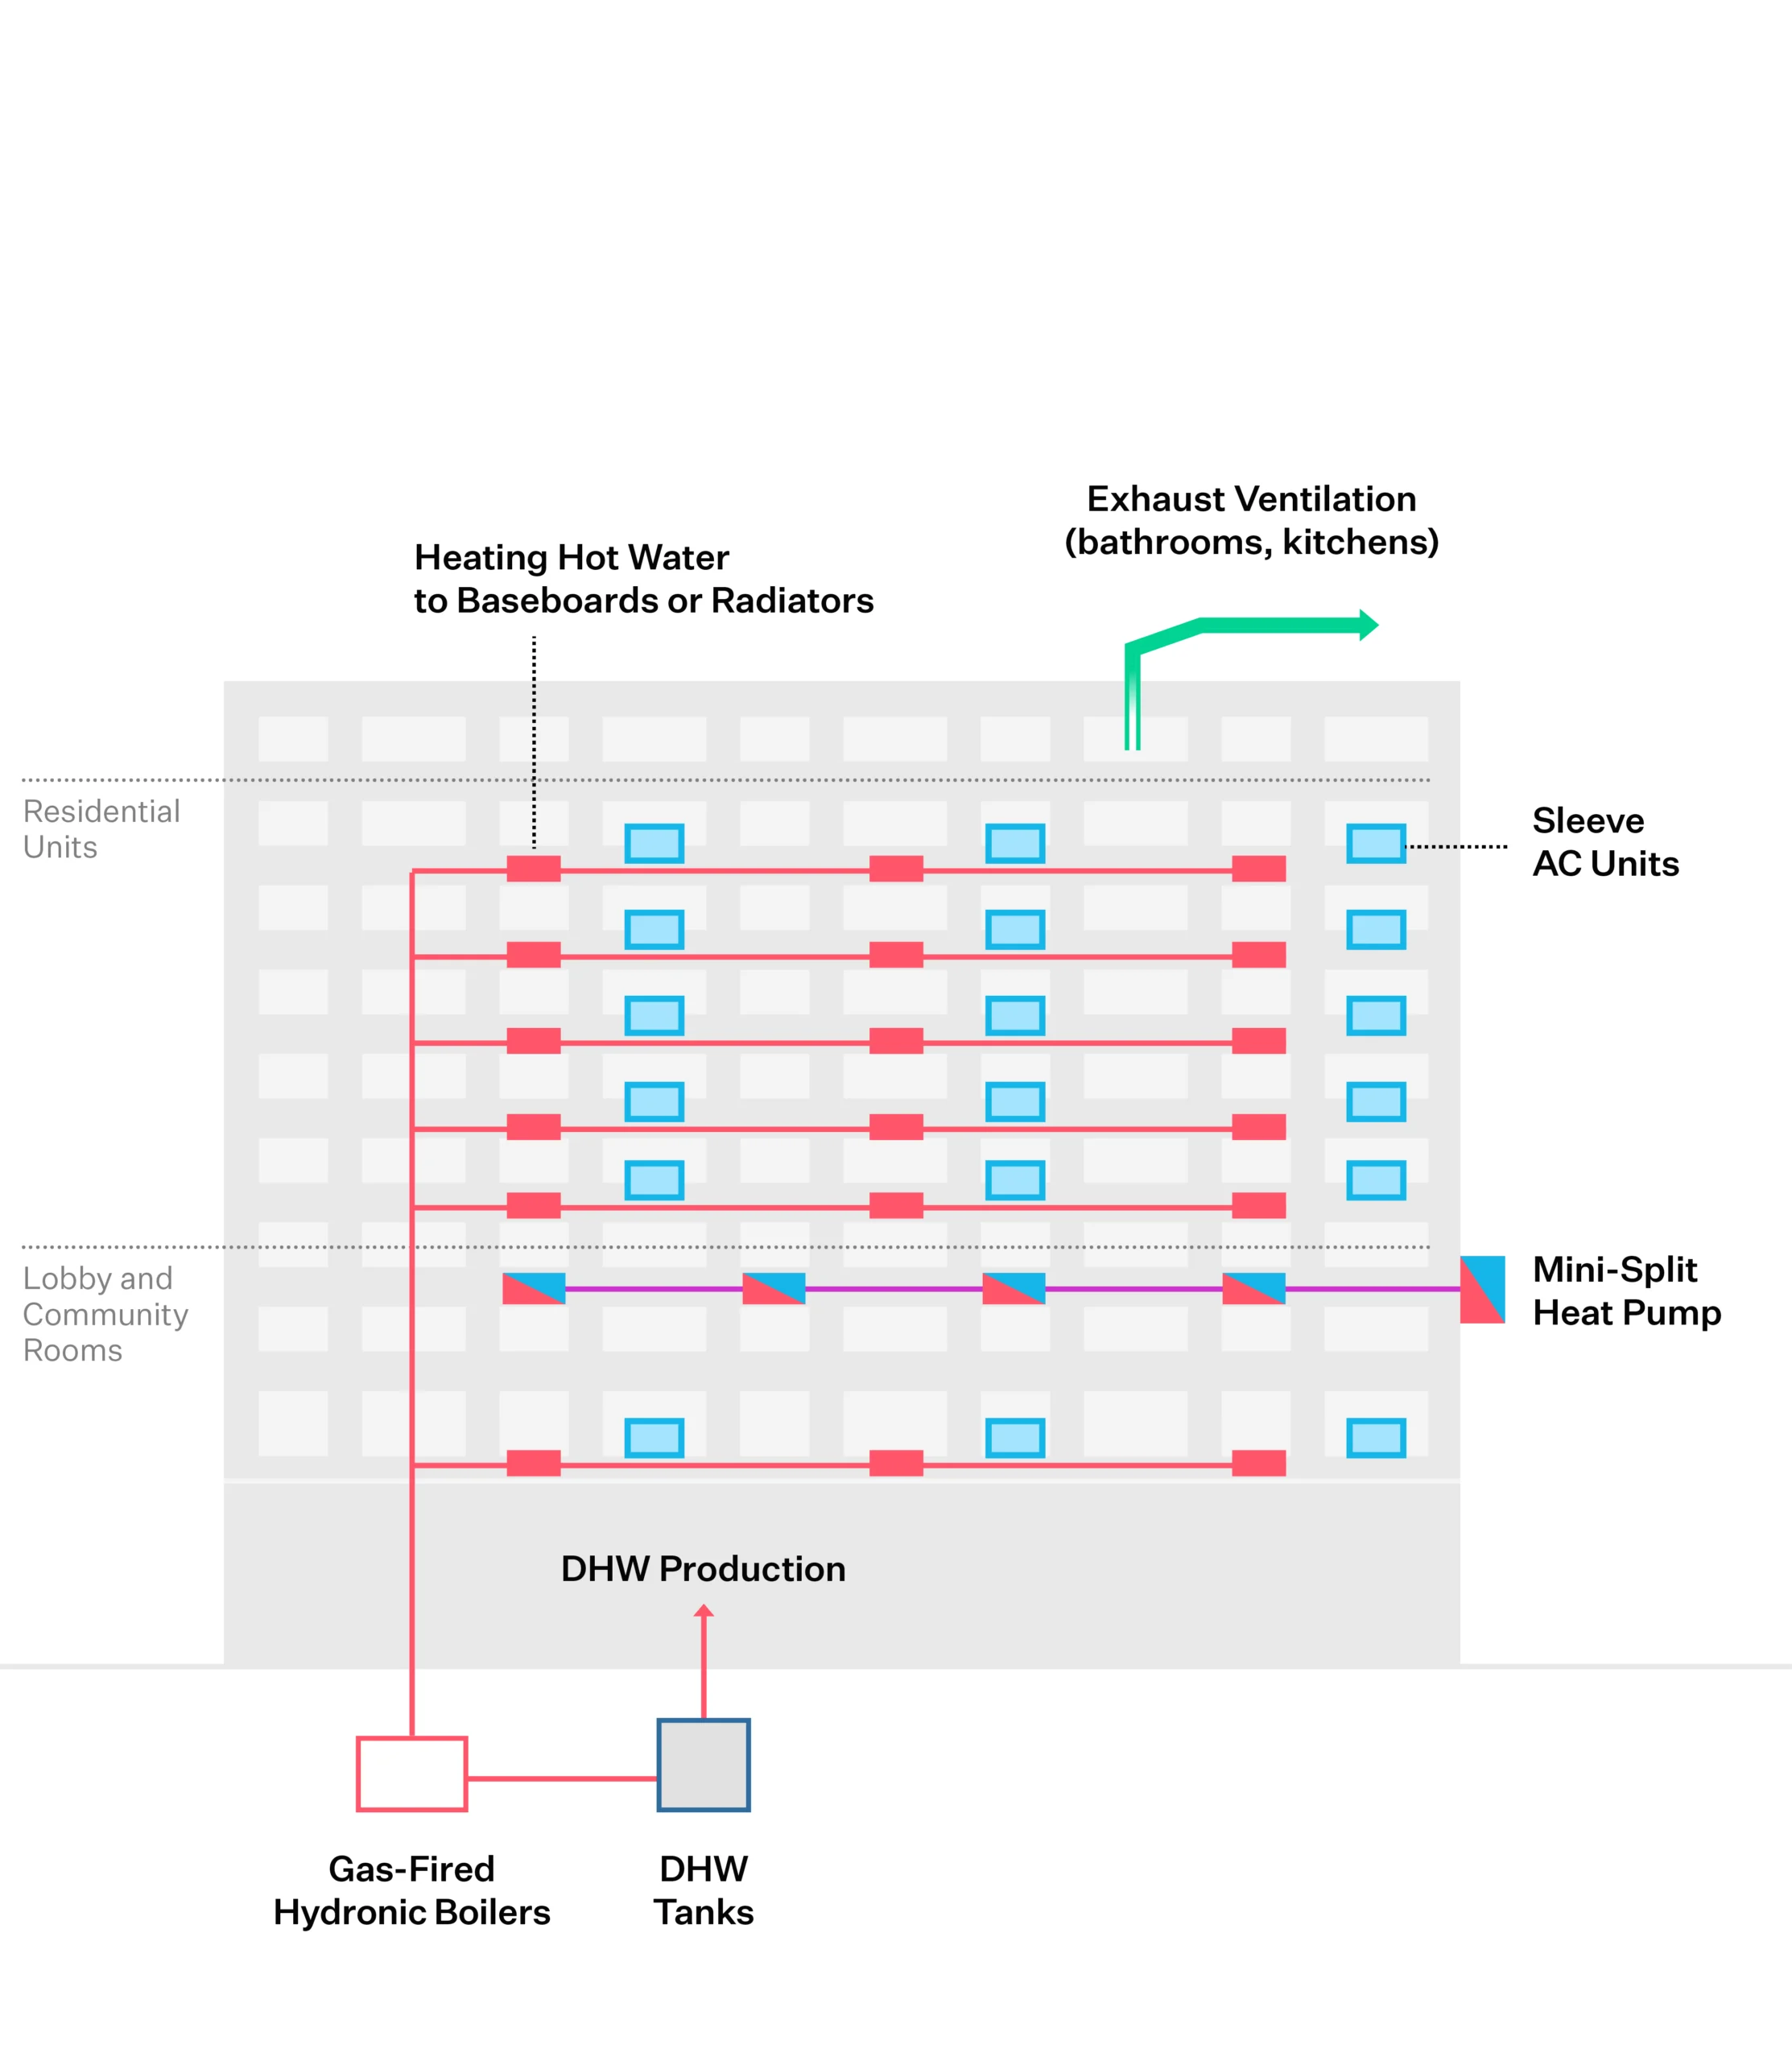
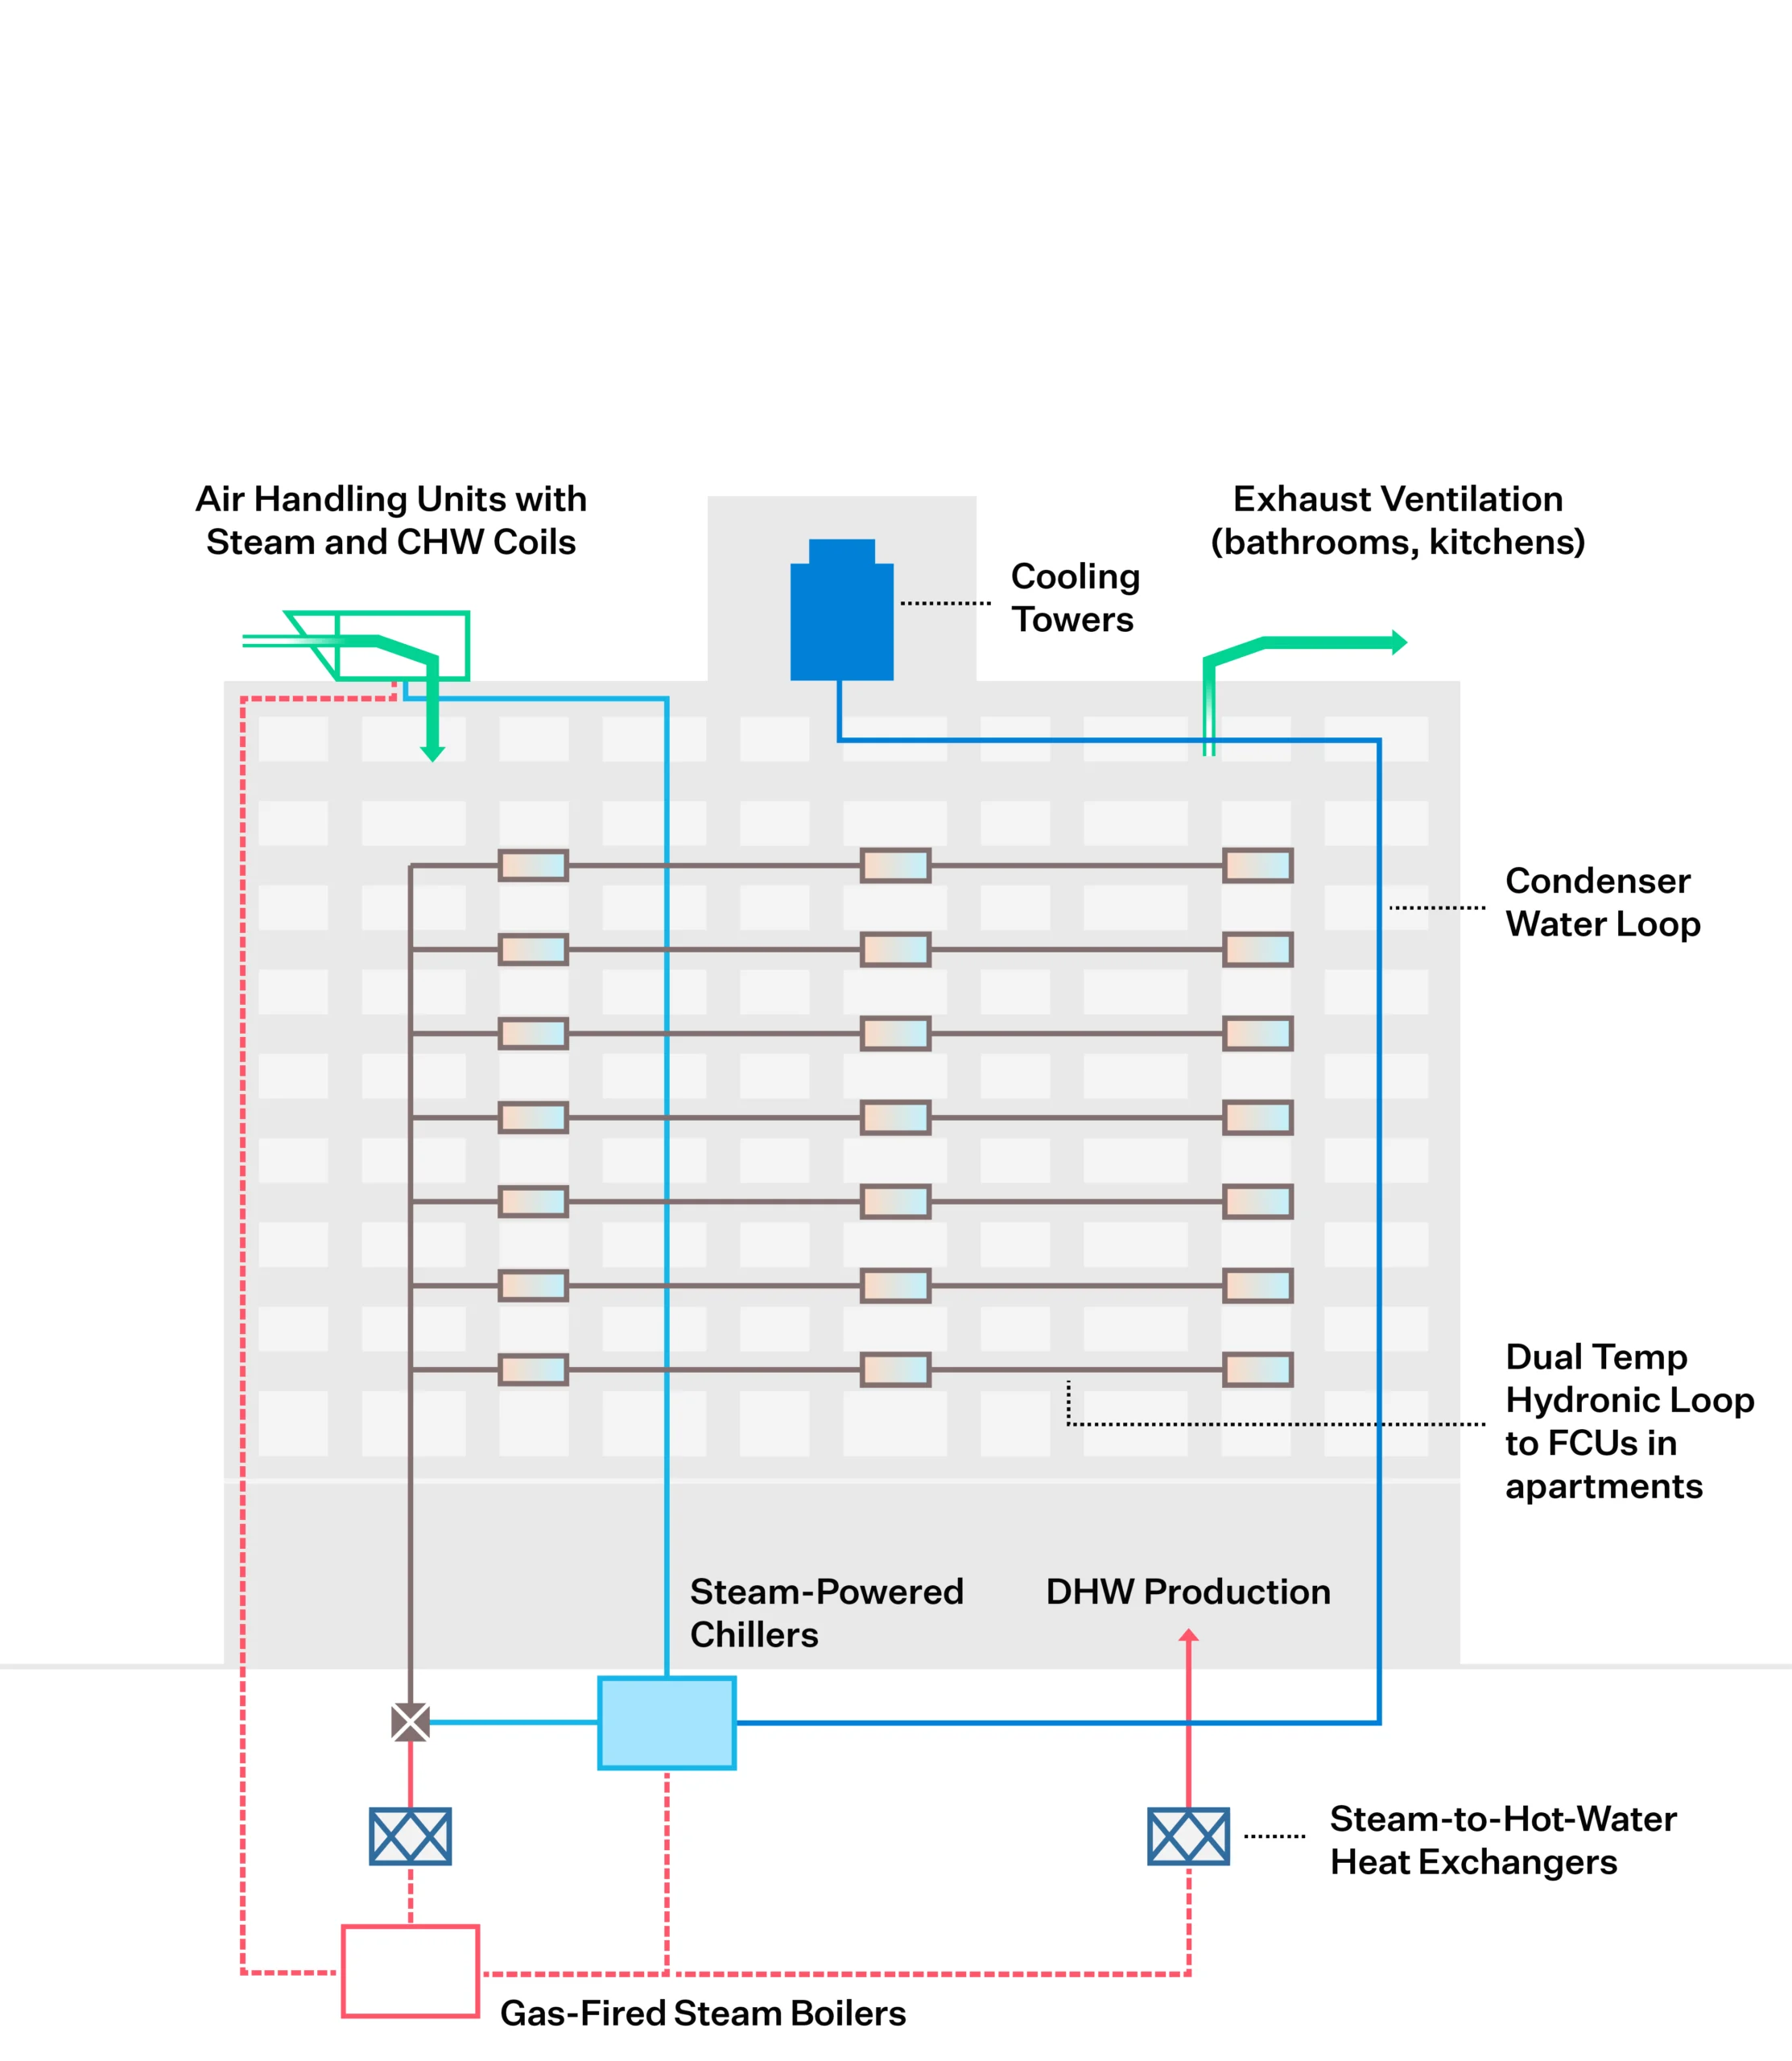
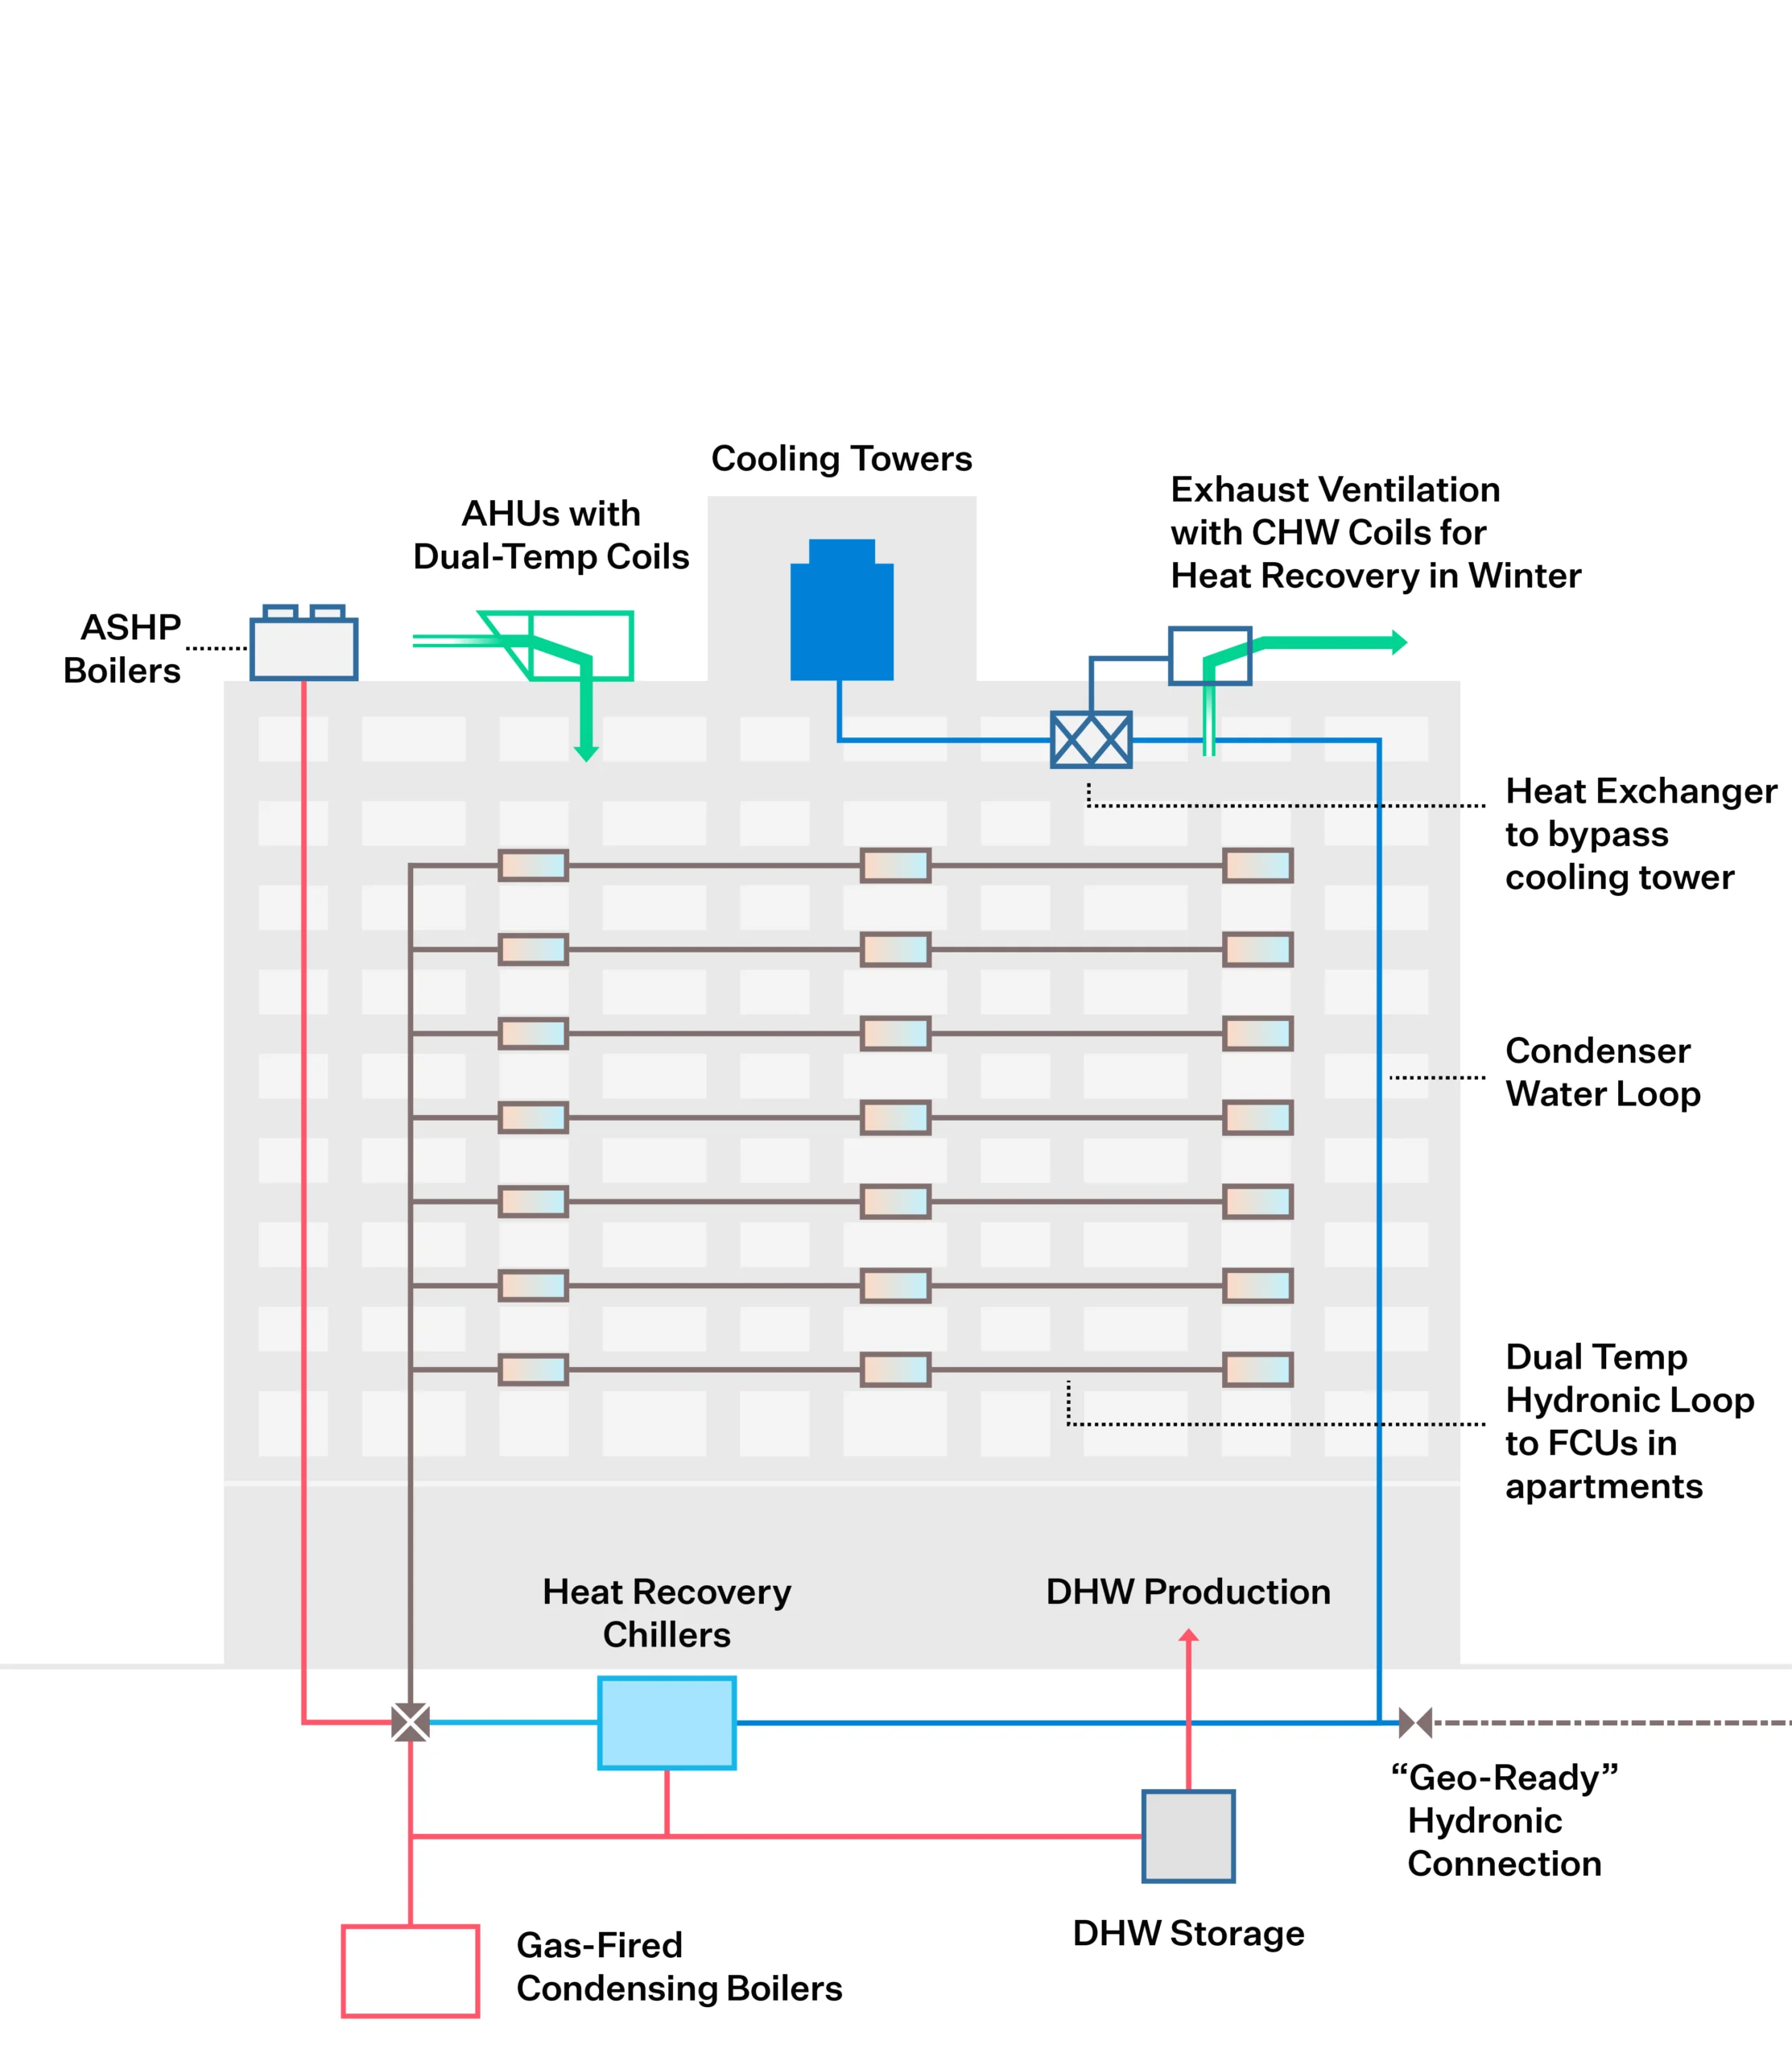
Existing Conditions
This diagram illustrates the building prior to the initiation of Strategic Decarbonization planning by the owners and their teams.
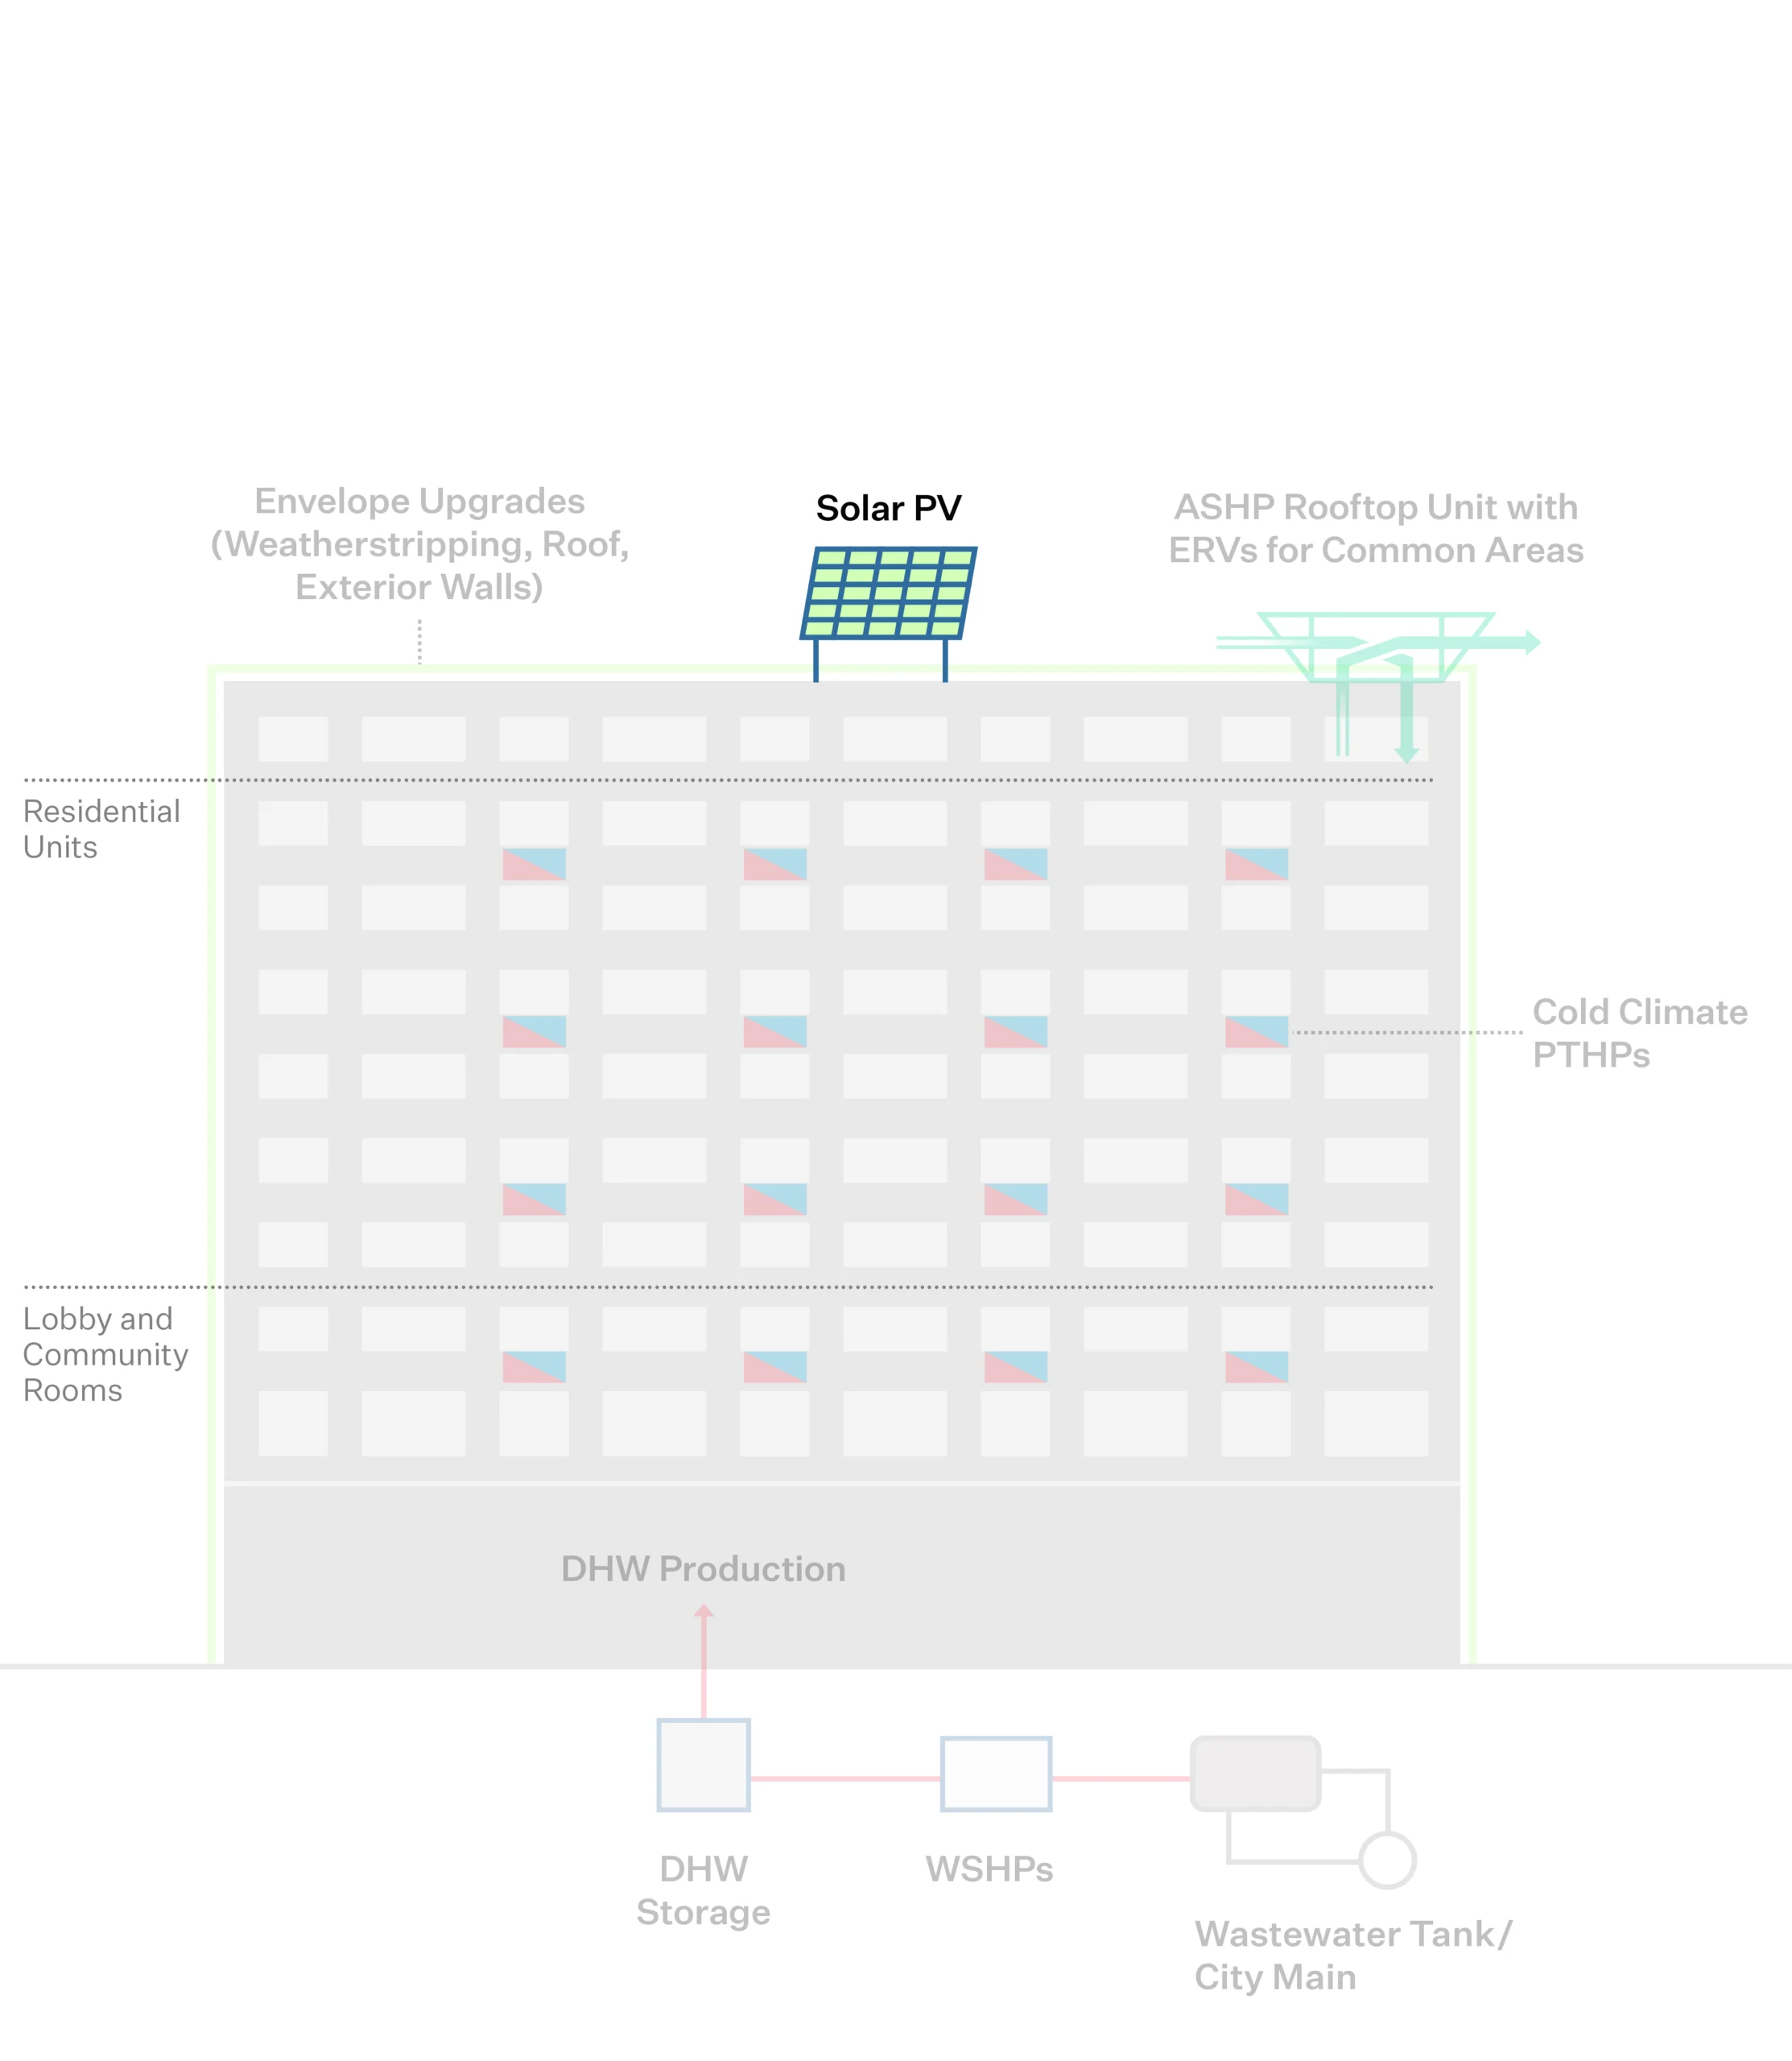
Click through the measures under “Building After” to understand the components of the building’s energy transition.
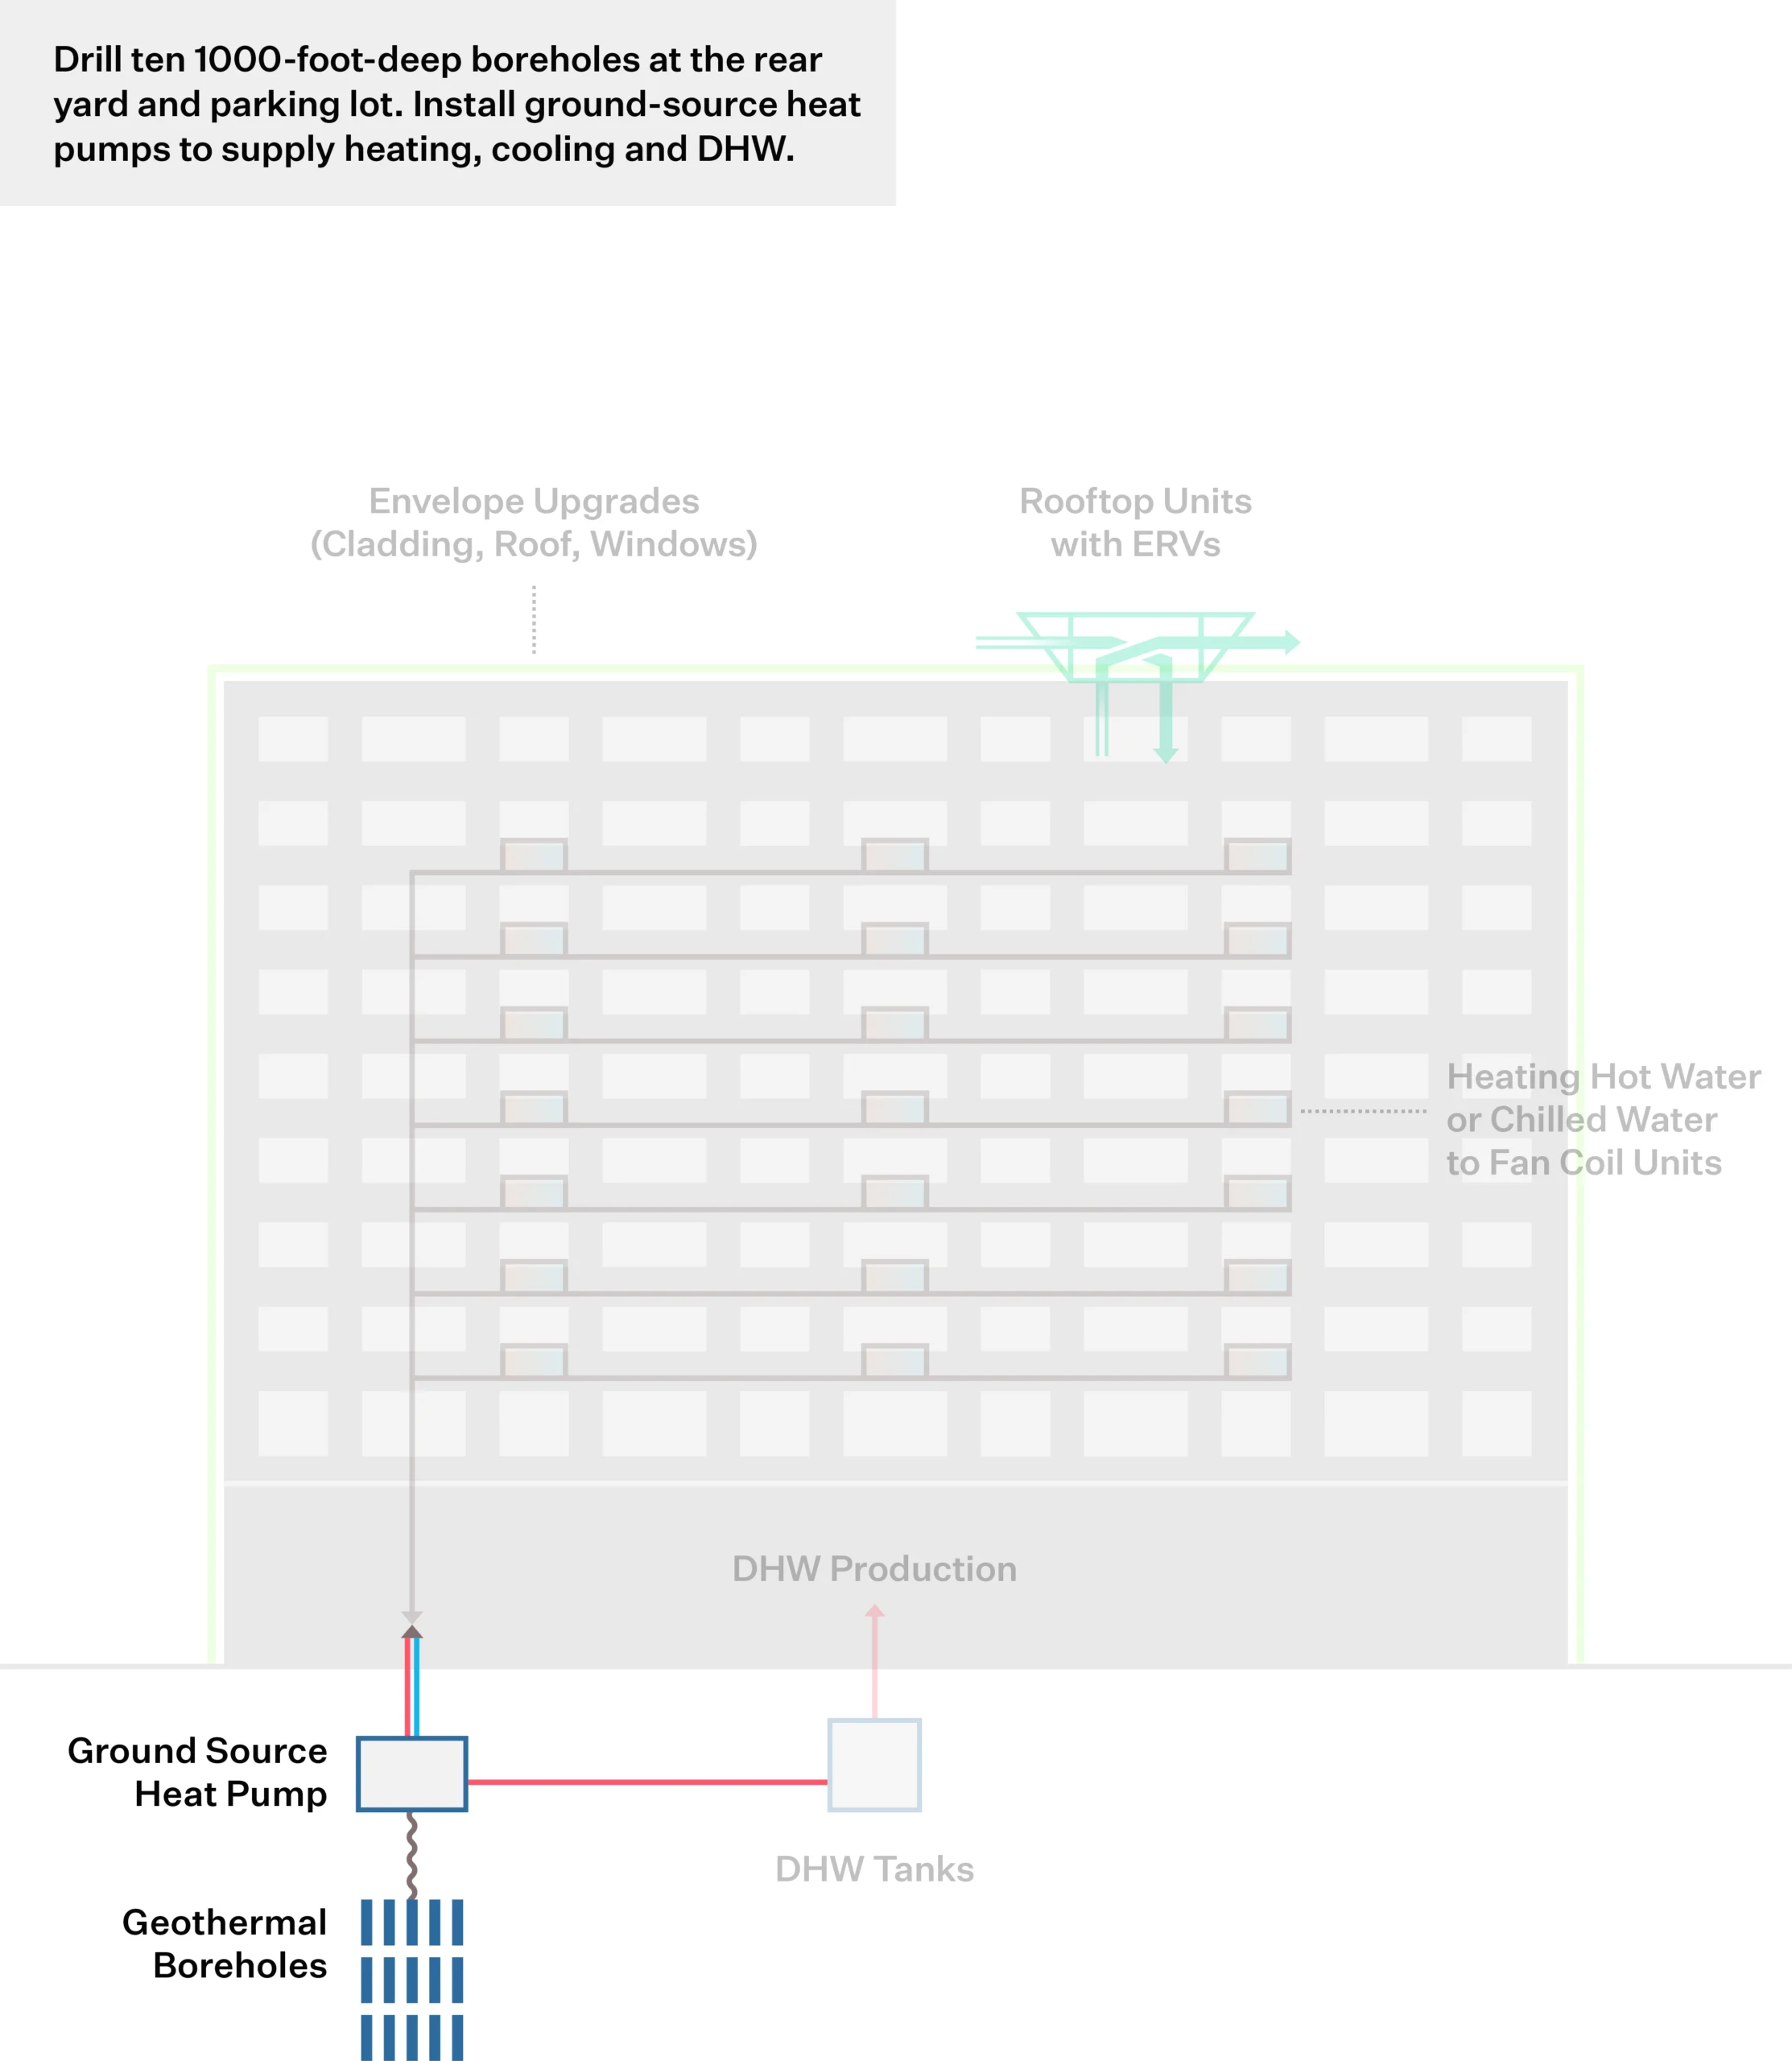
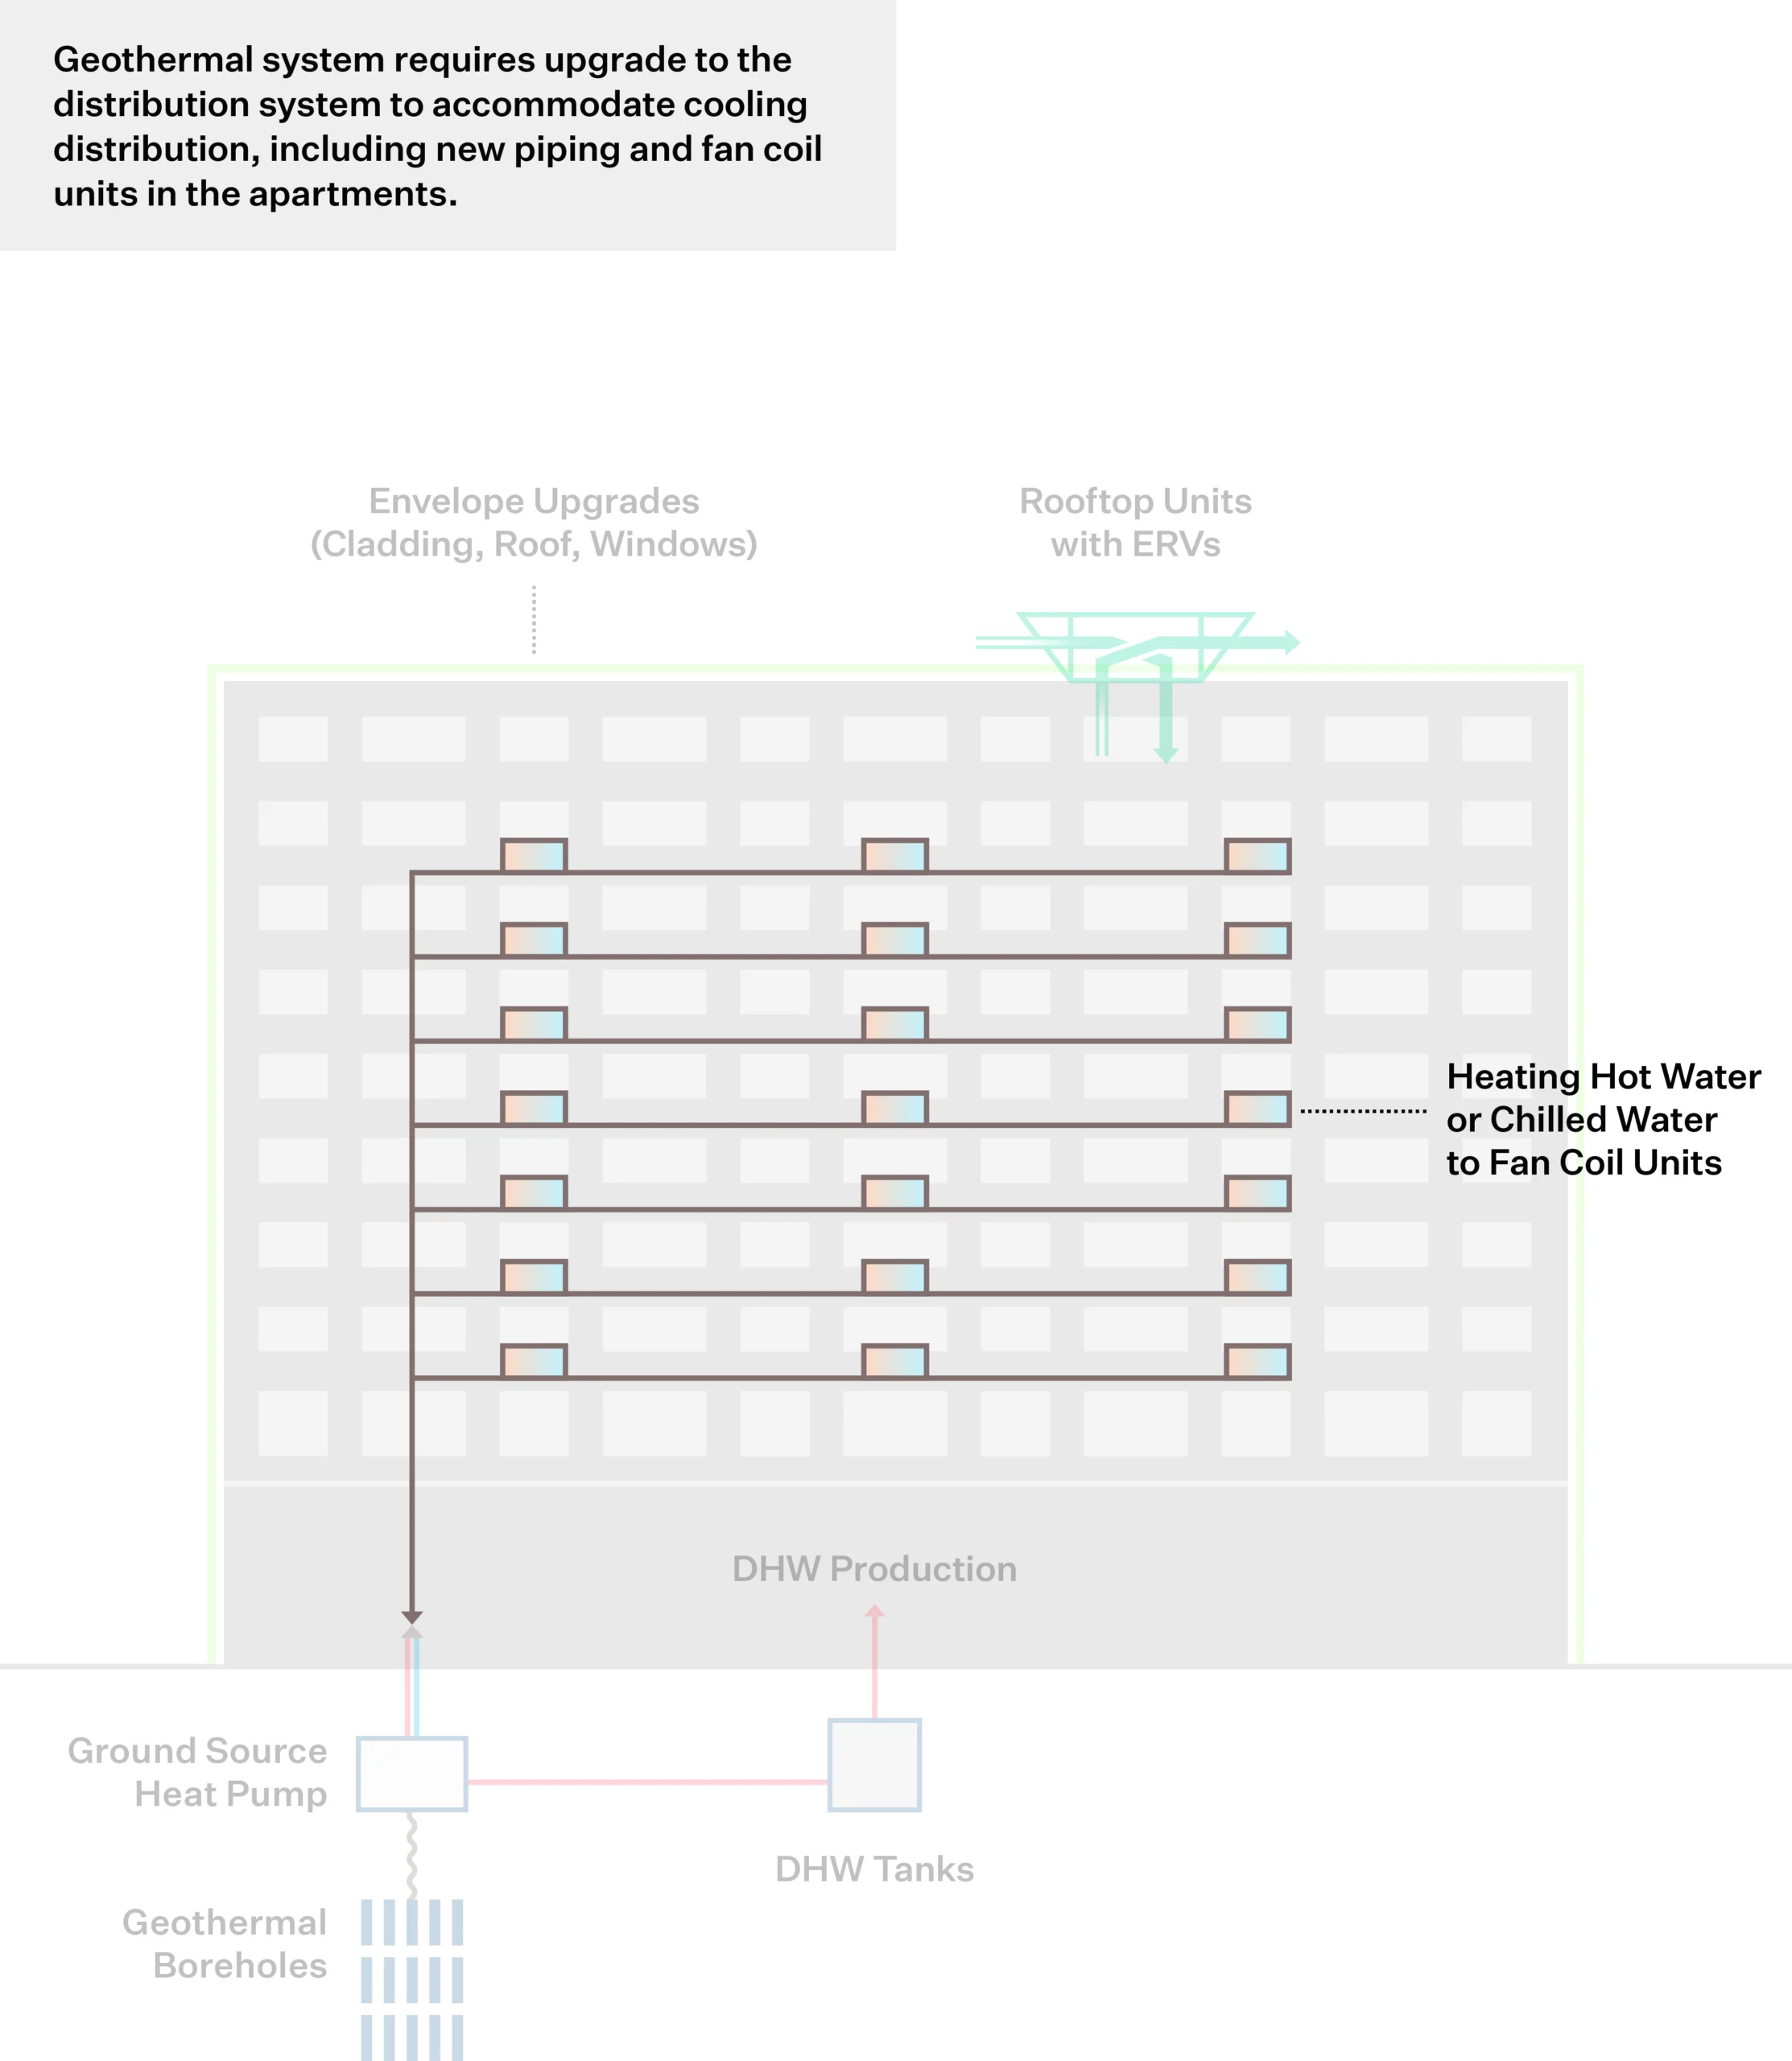
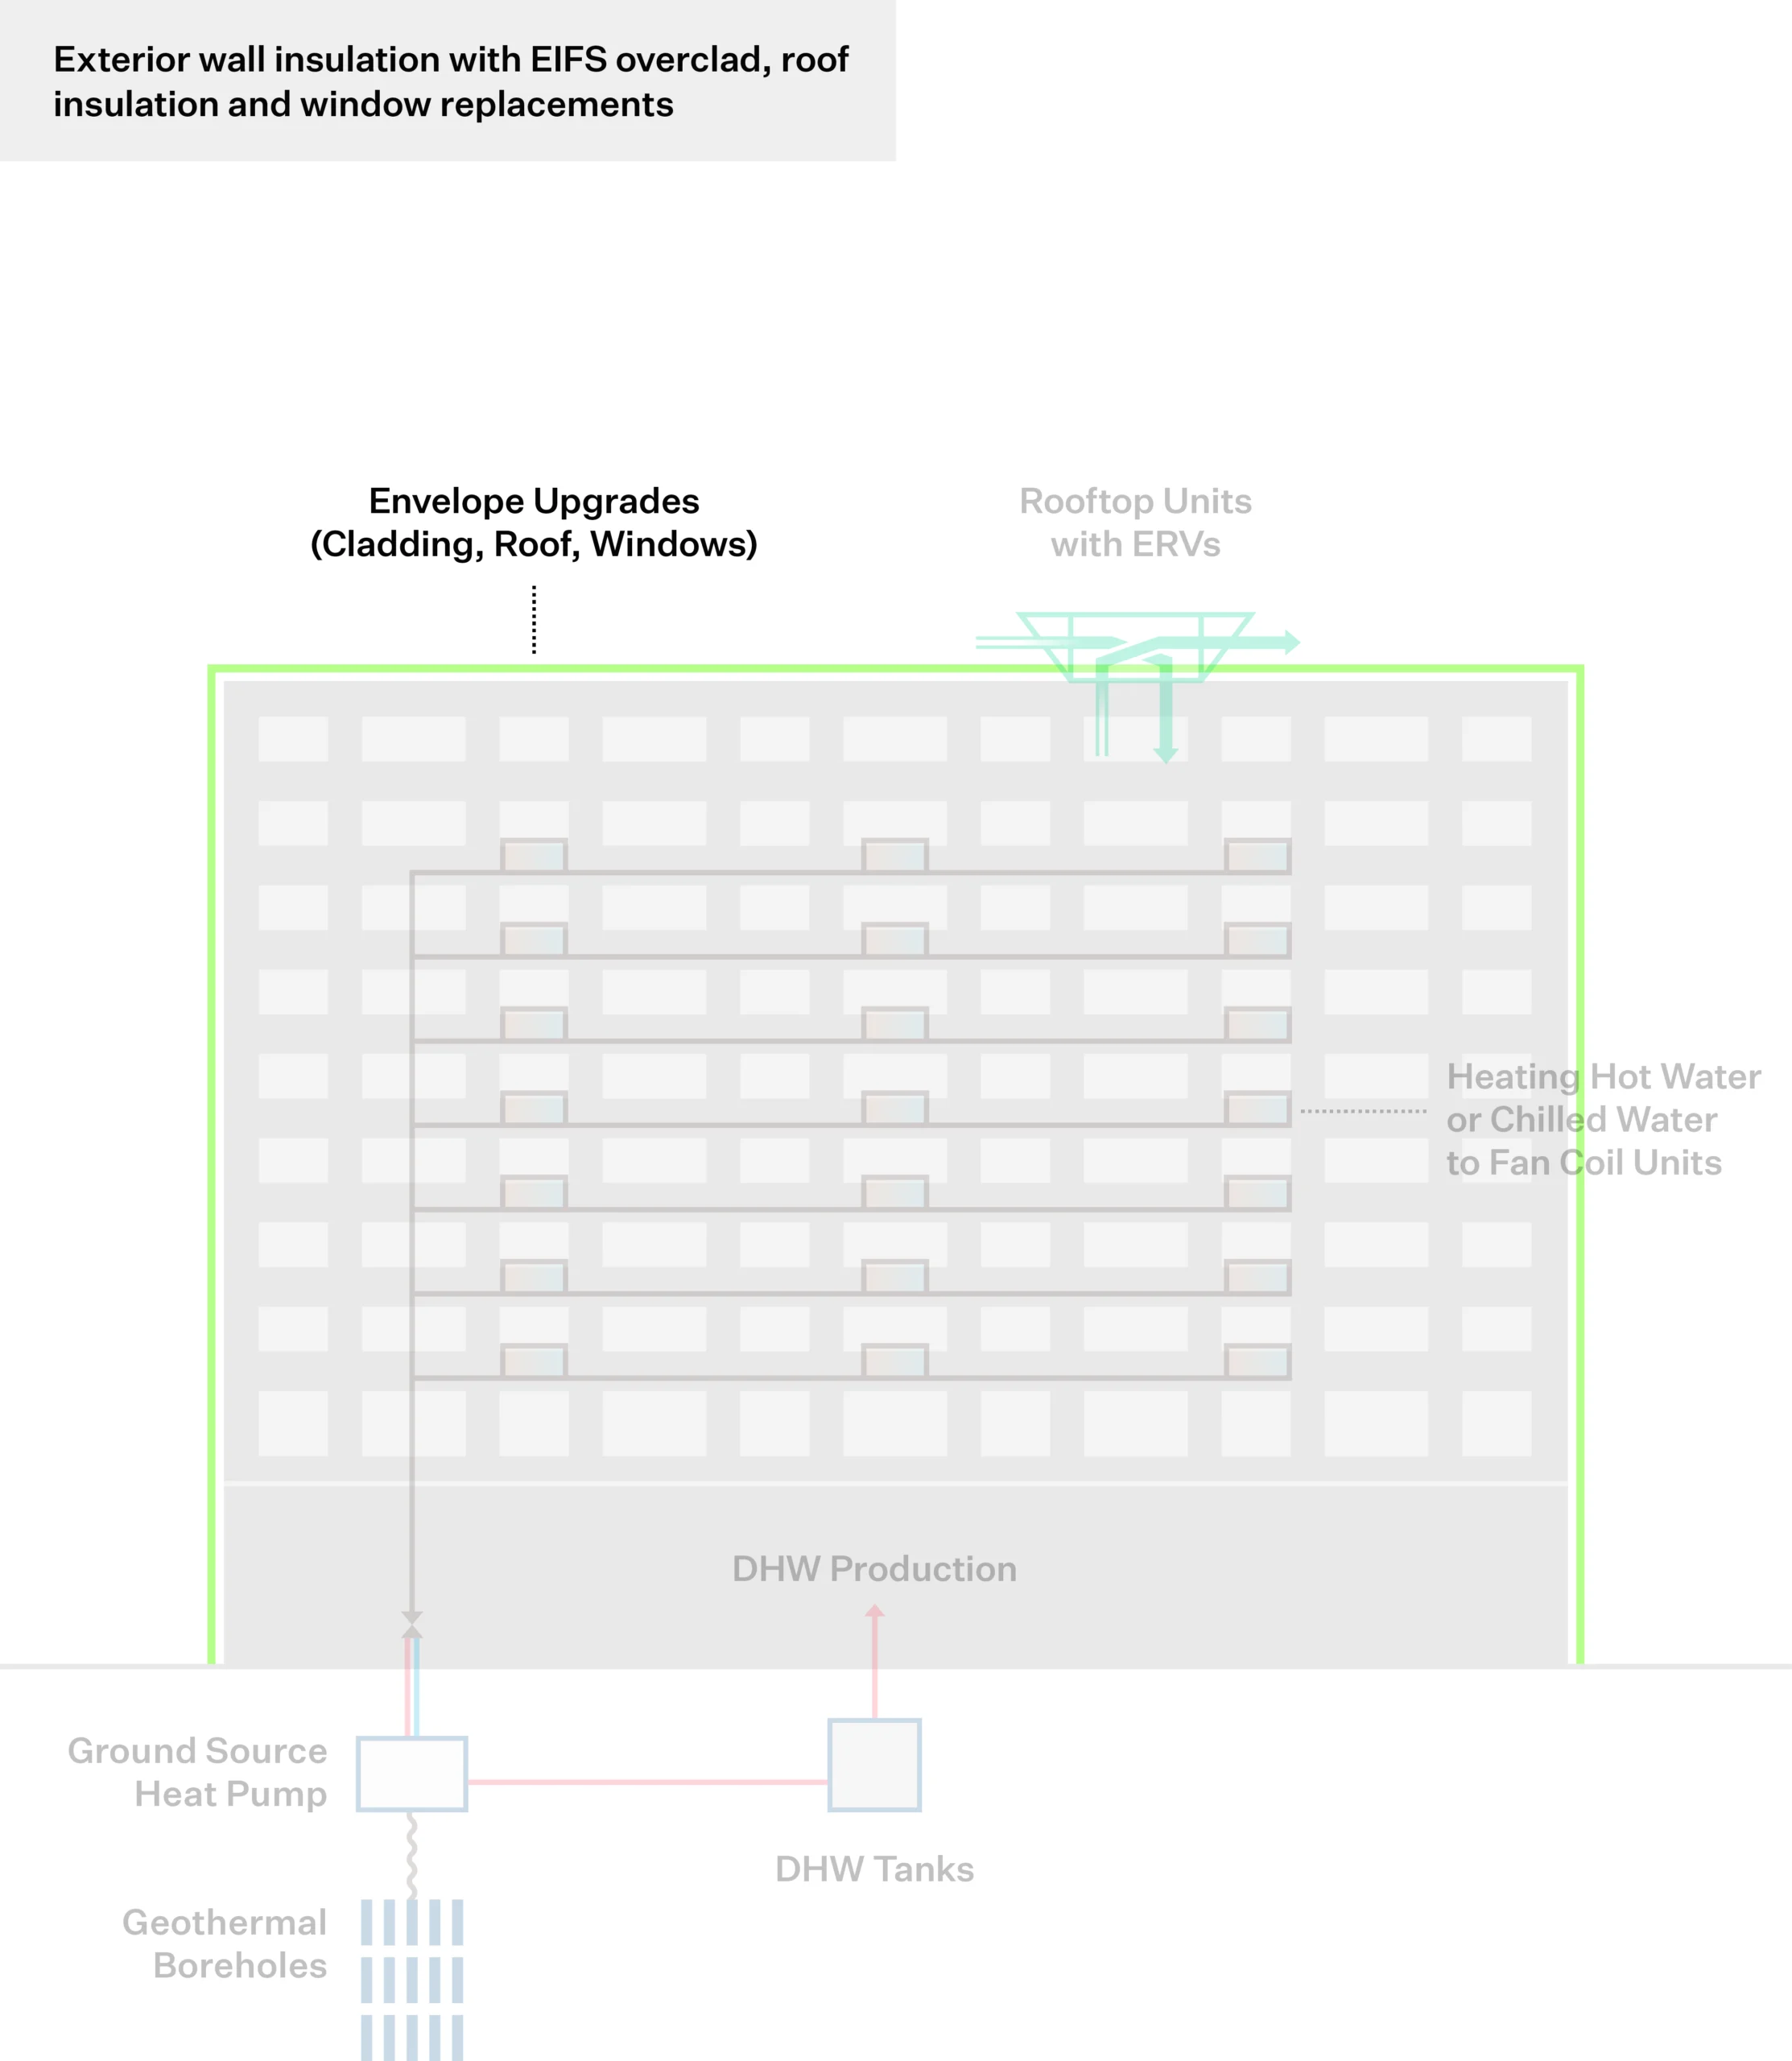
Sequence of Measures
2023
Building System Affected
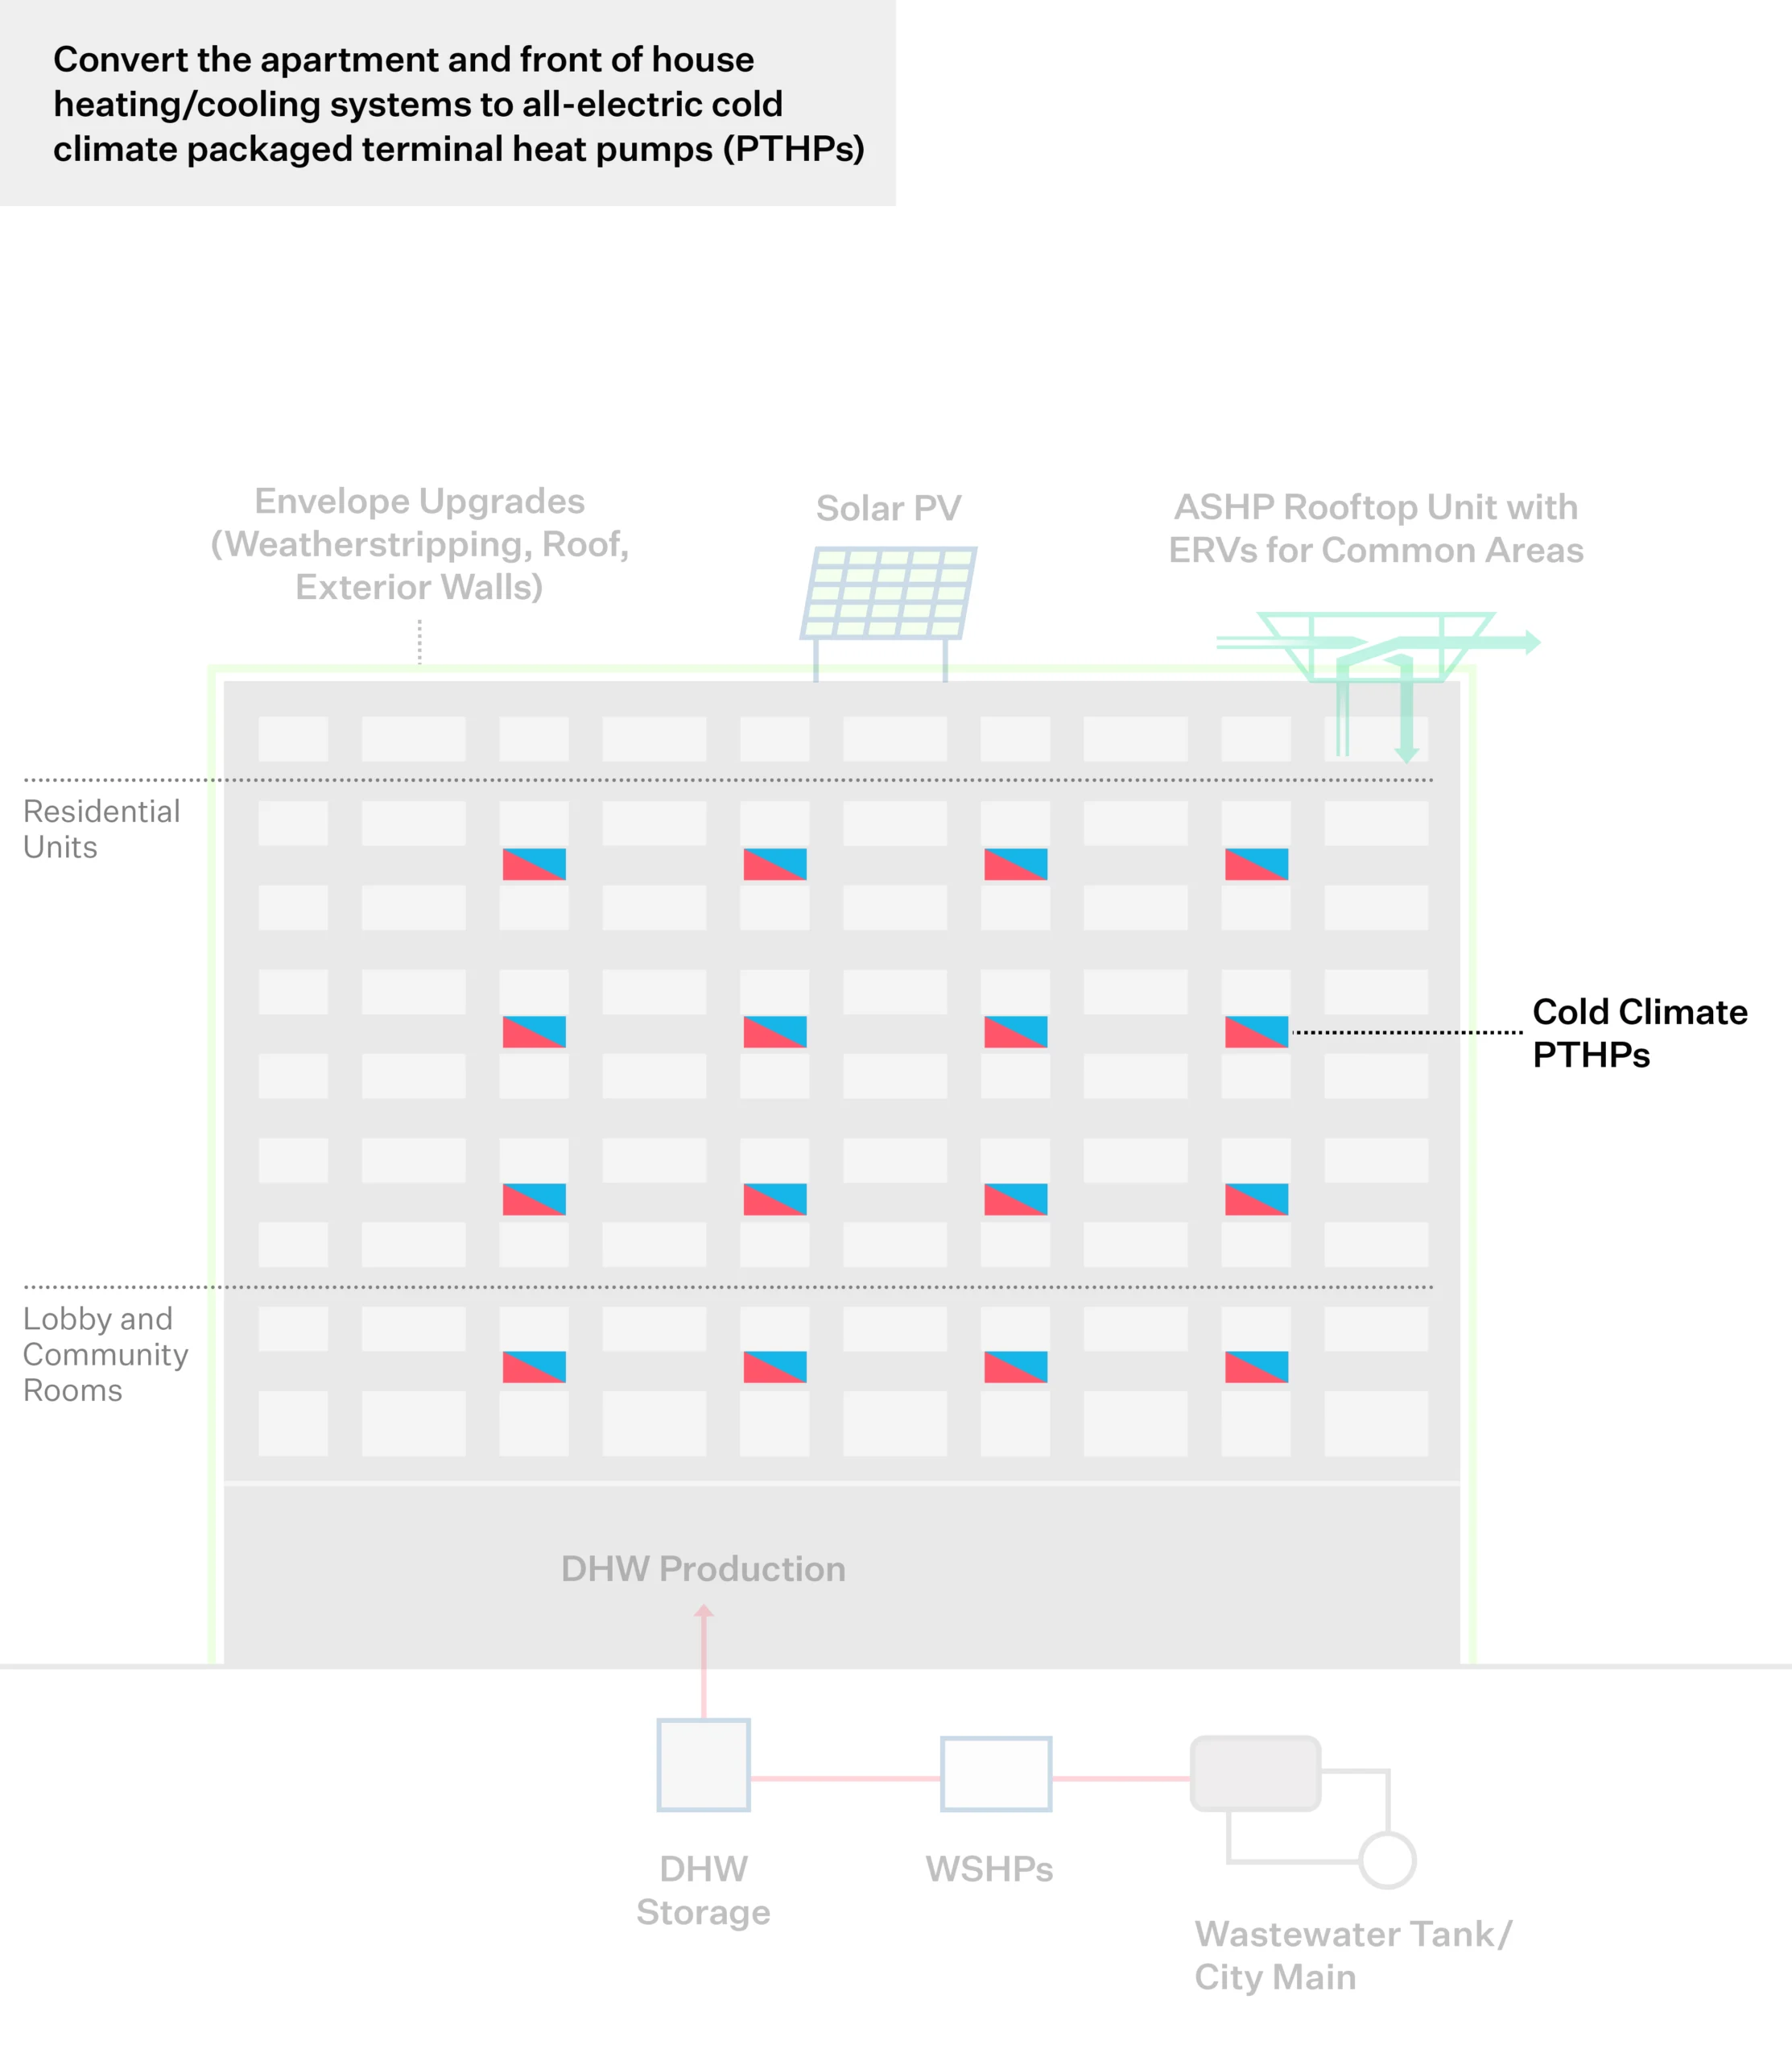
- heating
- cooling
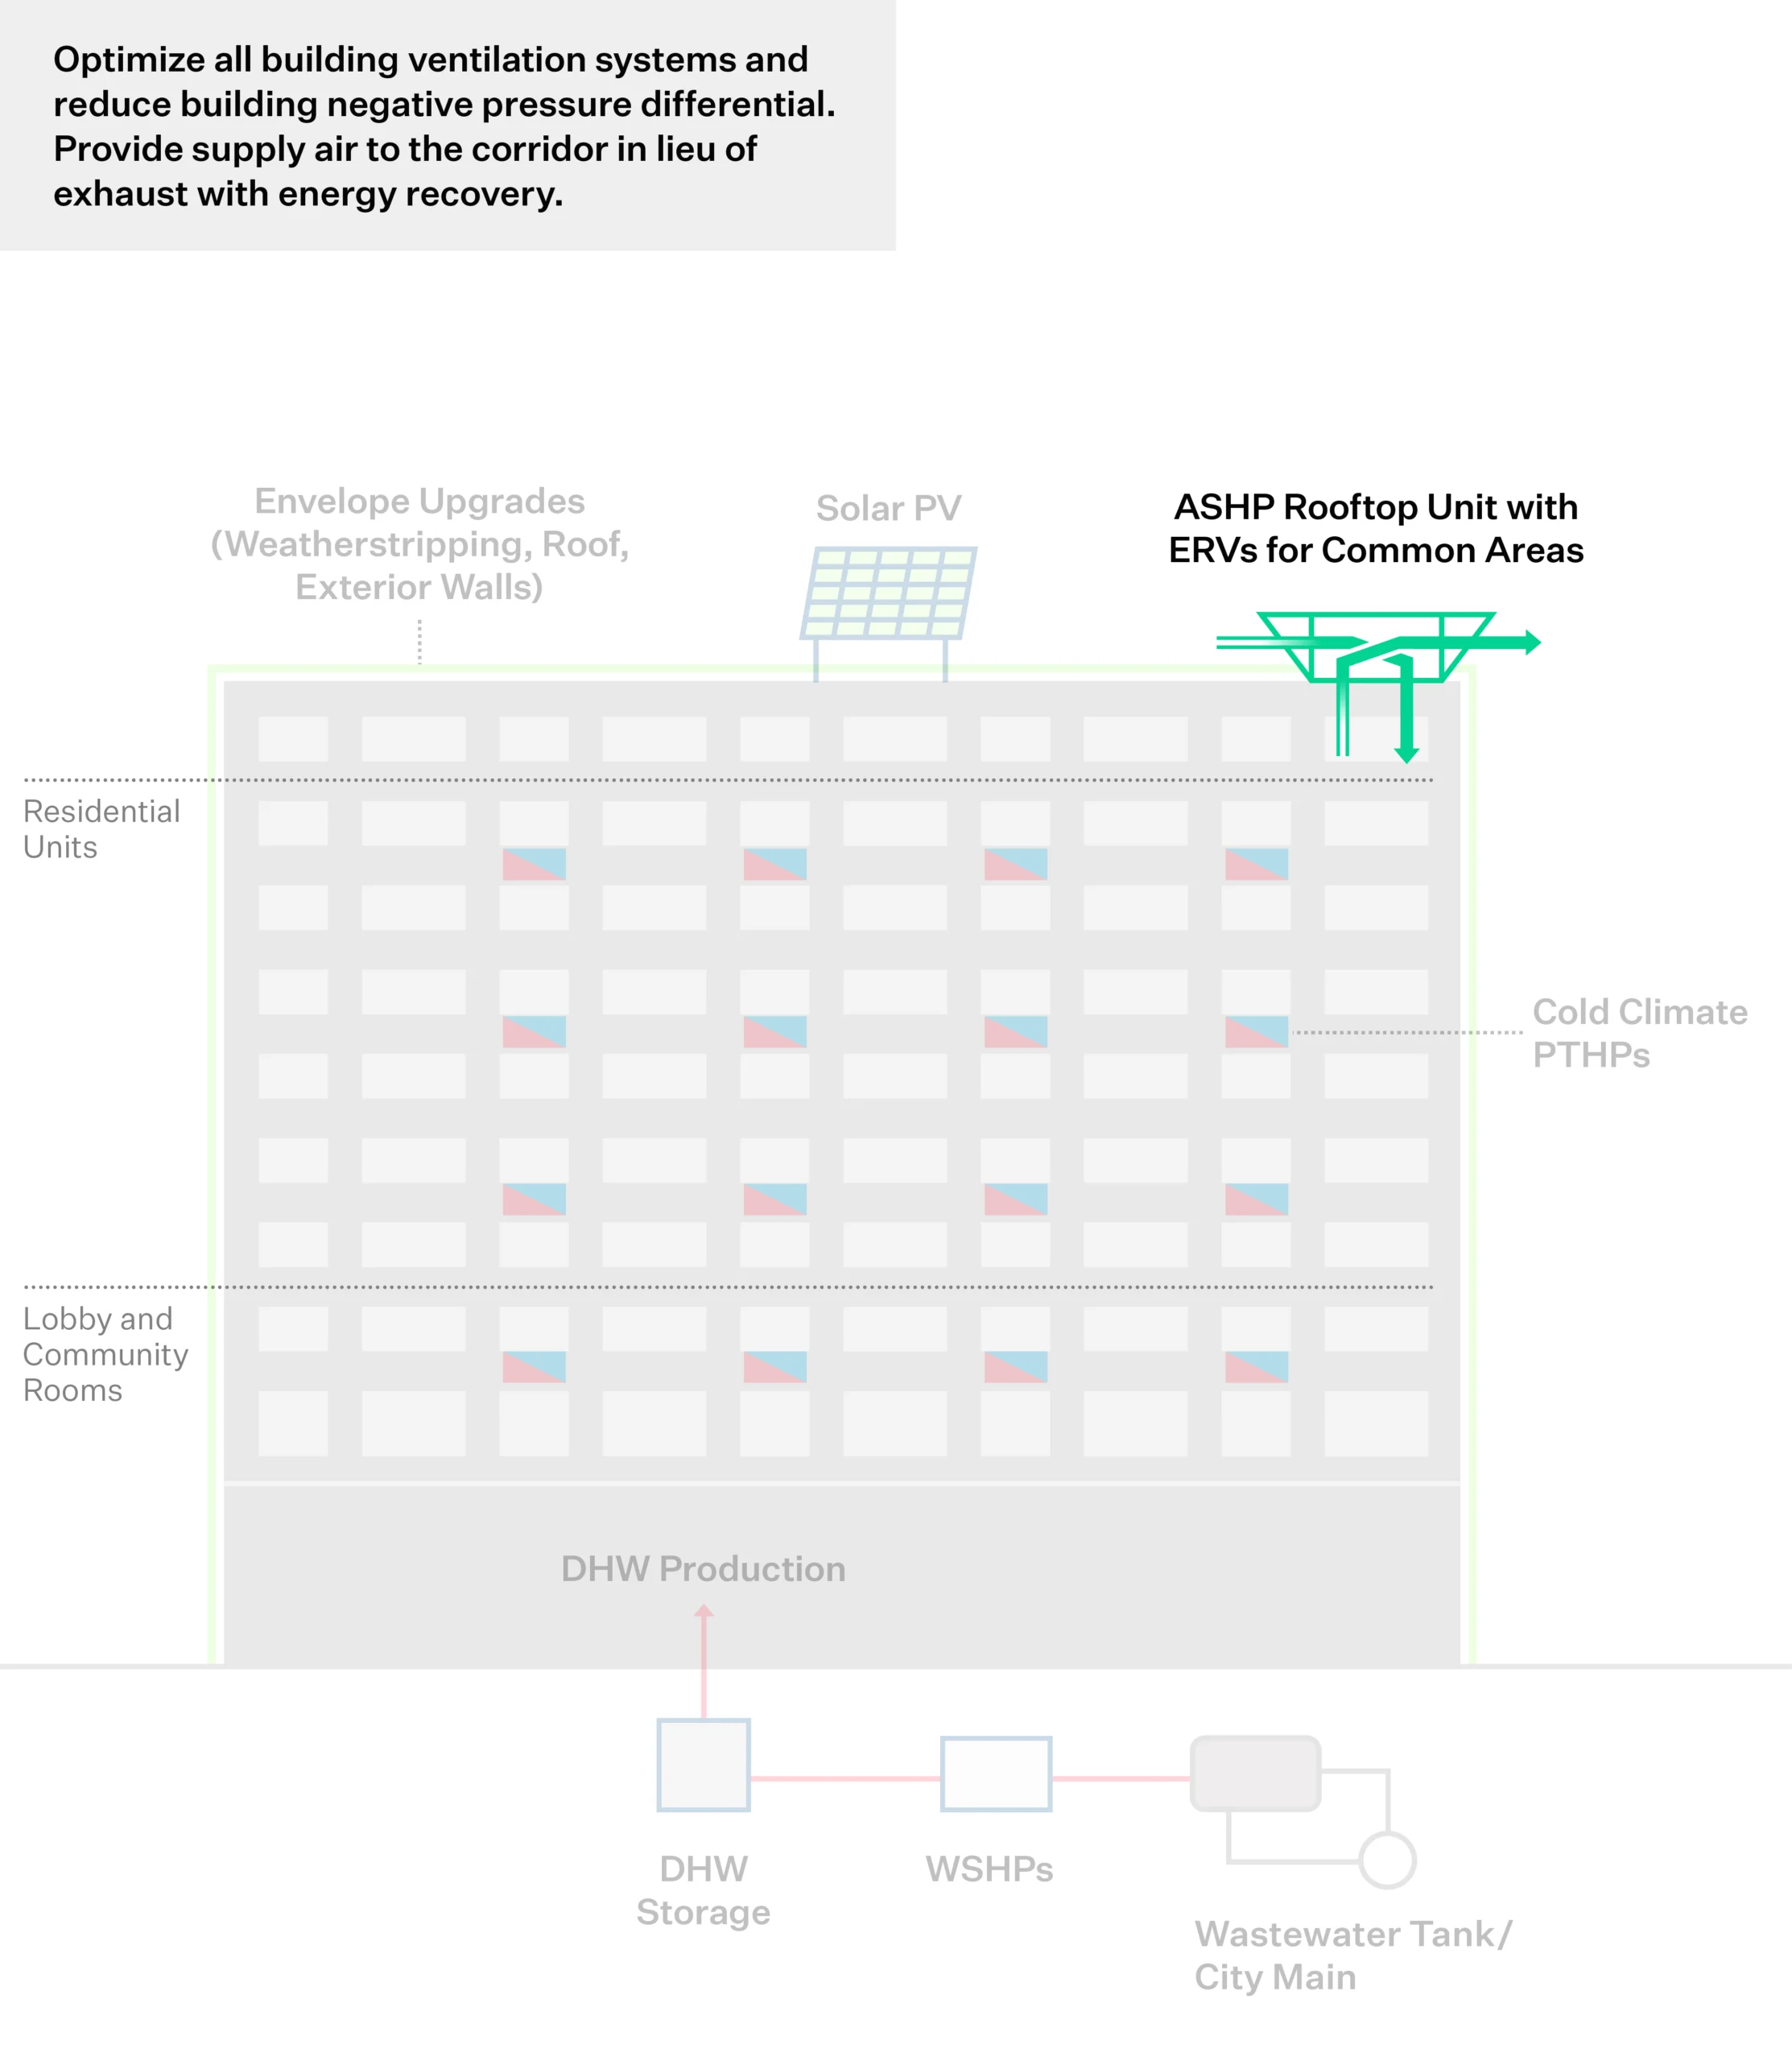
- ventilation
Step 3
Step 3: Build the Business Case
Making a business case for strategic decarbonization requires thinking beyond a traditional energy audit approach or simple payback analysis. It assesses business-as-usual costs and risks against the costs and added value of phased decarbonization investments in the long-term.

Decarbonization Costs
$9.3M
Capital costs of decarbonization (e.g. total cost to install all measures)

Business-as-Usual Costs
$5.1M
Energy cost savings: 97k.
BAU cost of system replacement/upgrades: 5M.
Business-as-Usual Risks
$89,000
Avoided Local Law 97 or other regulatory fines

Decarbonization Value
$3.3M
Incentives

Net Present Value
7.3% IRR
Strategic Decarbonization Action Plan
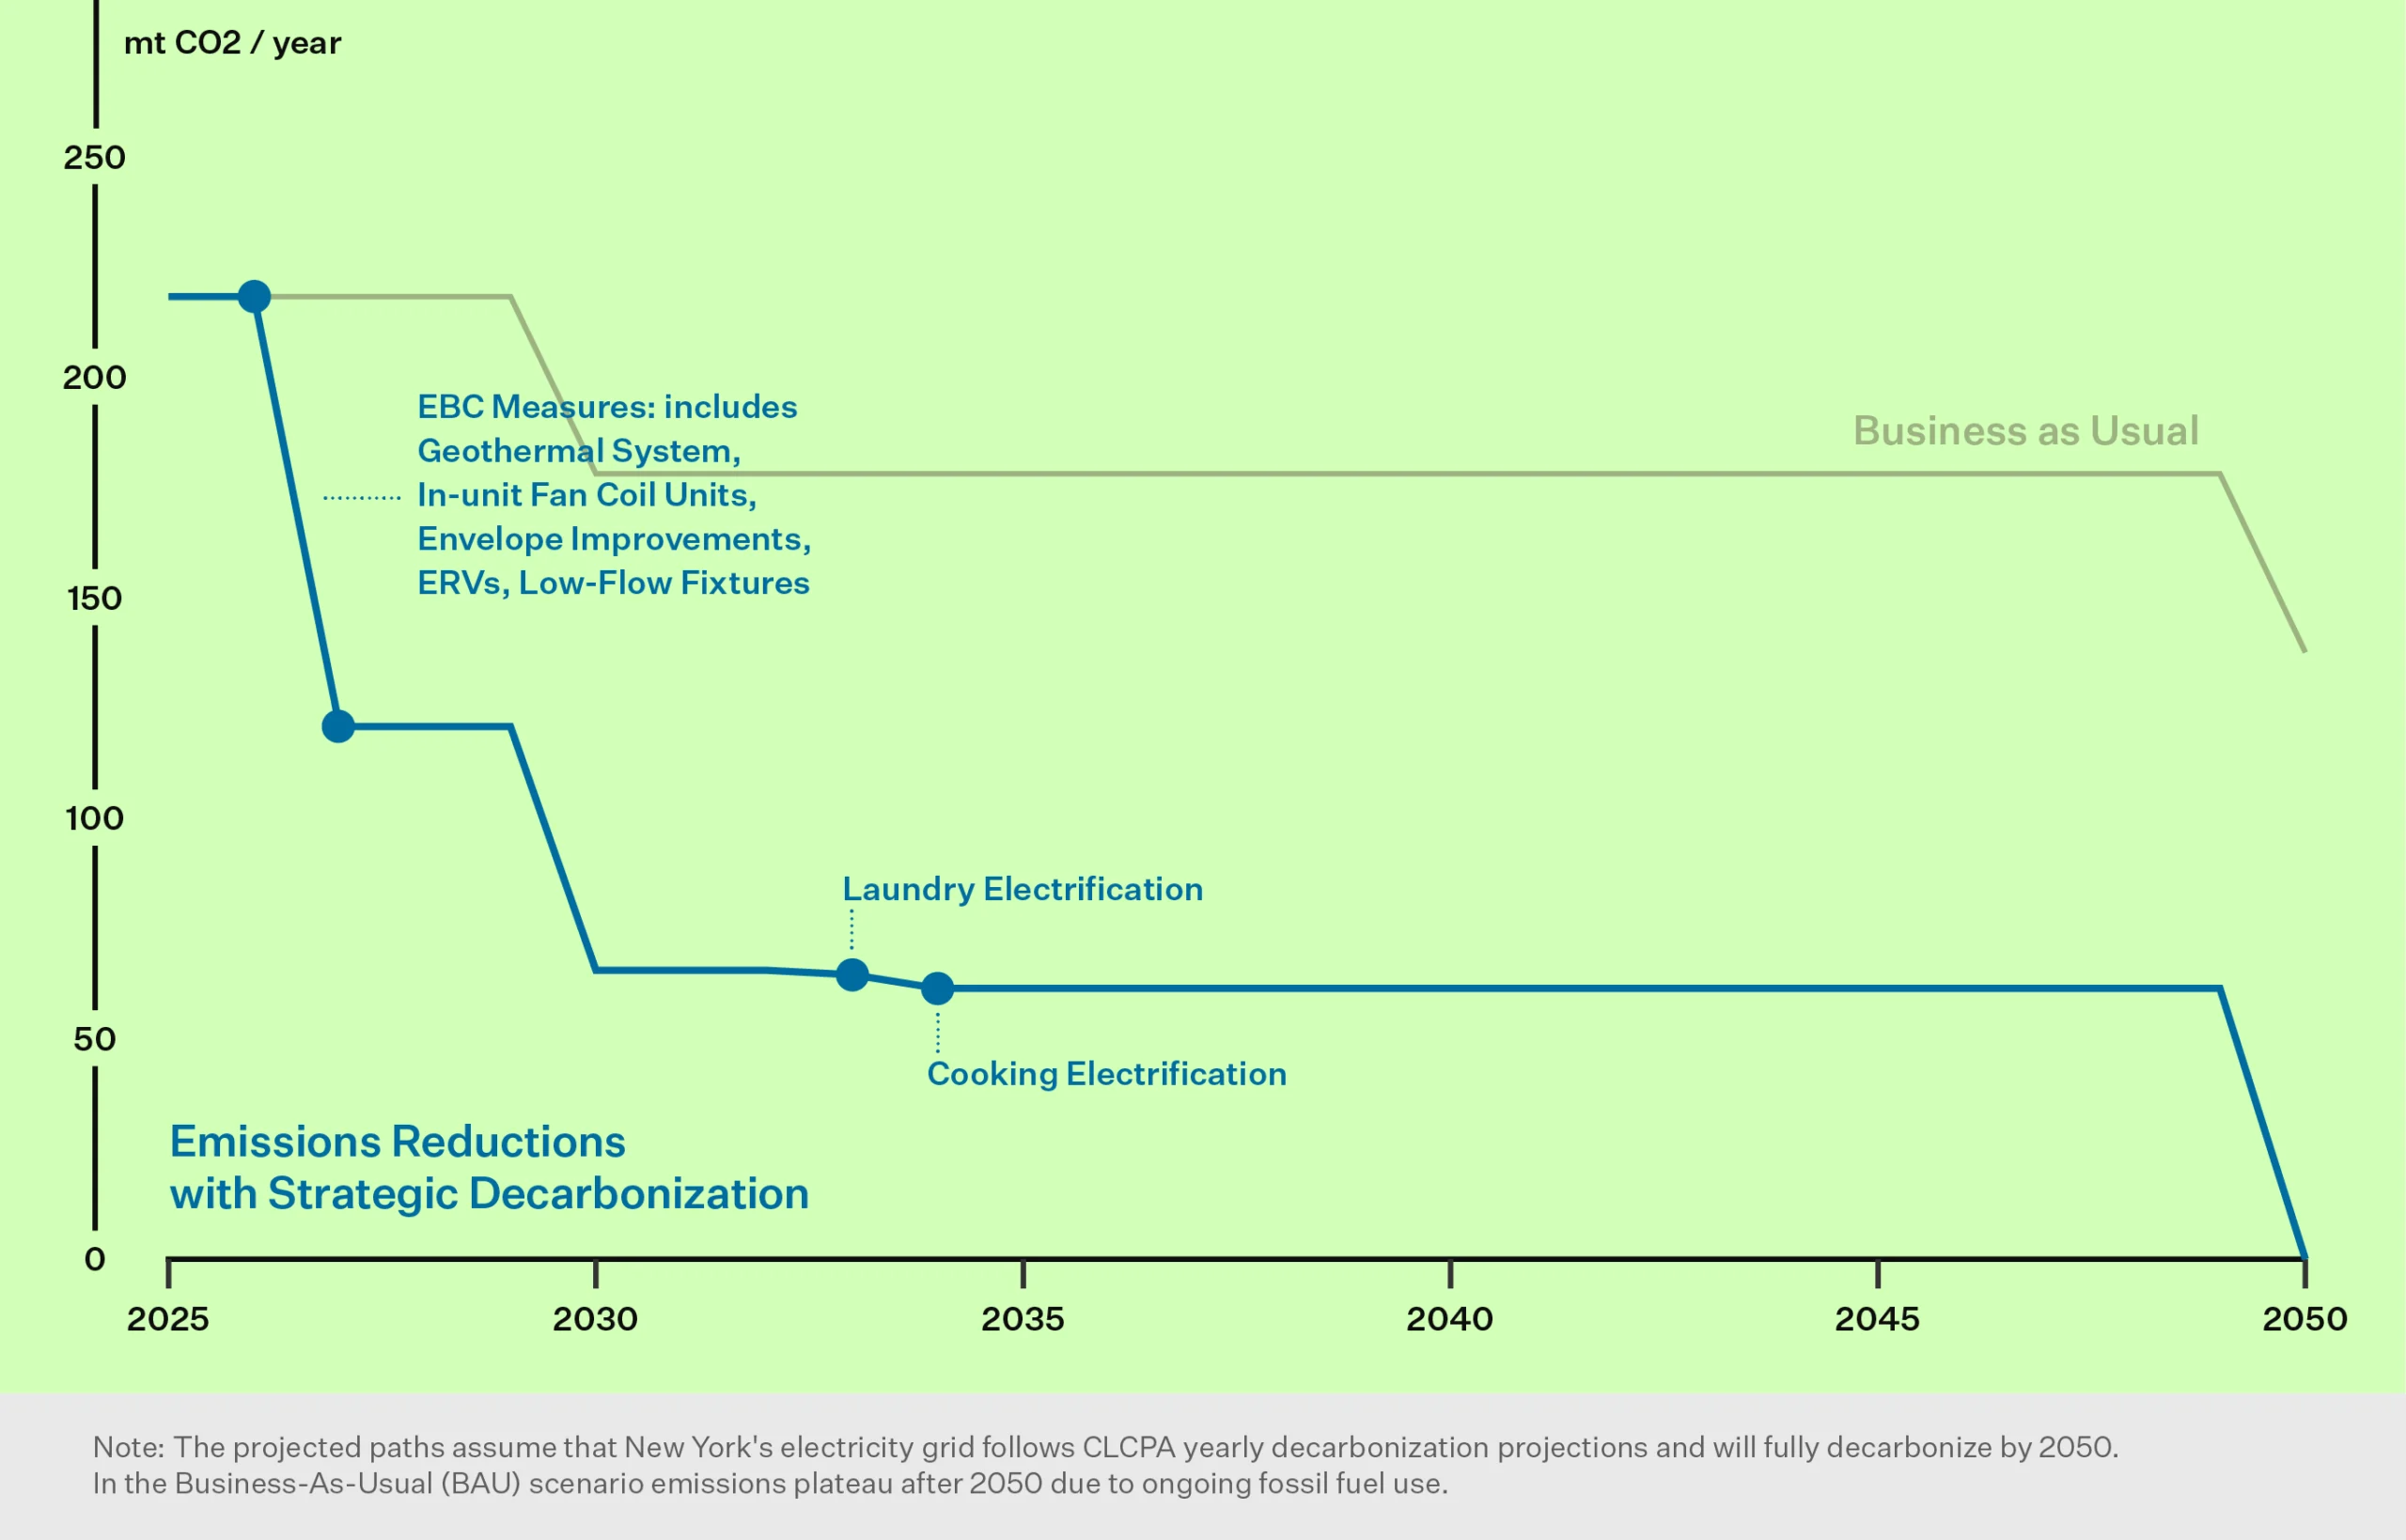
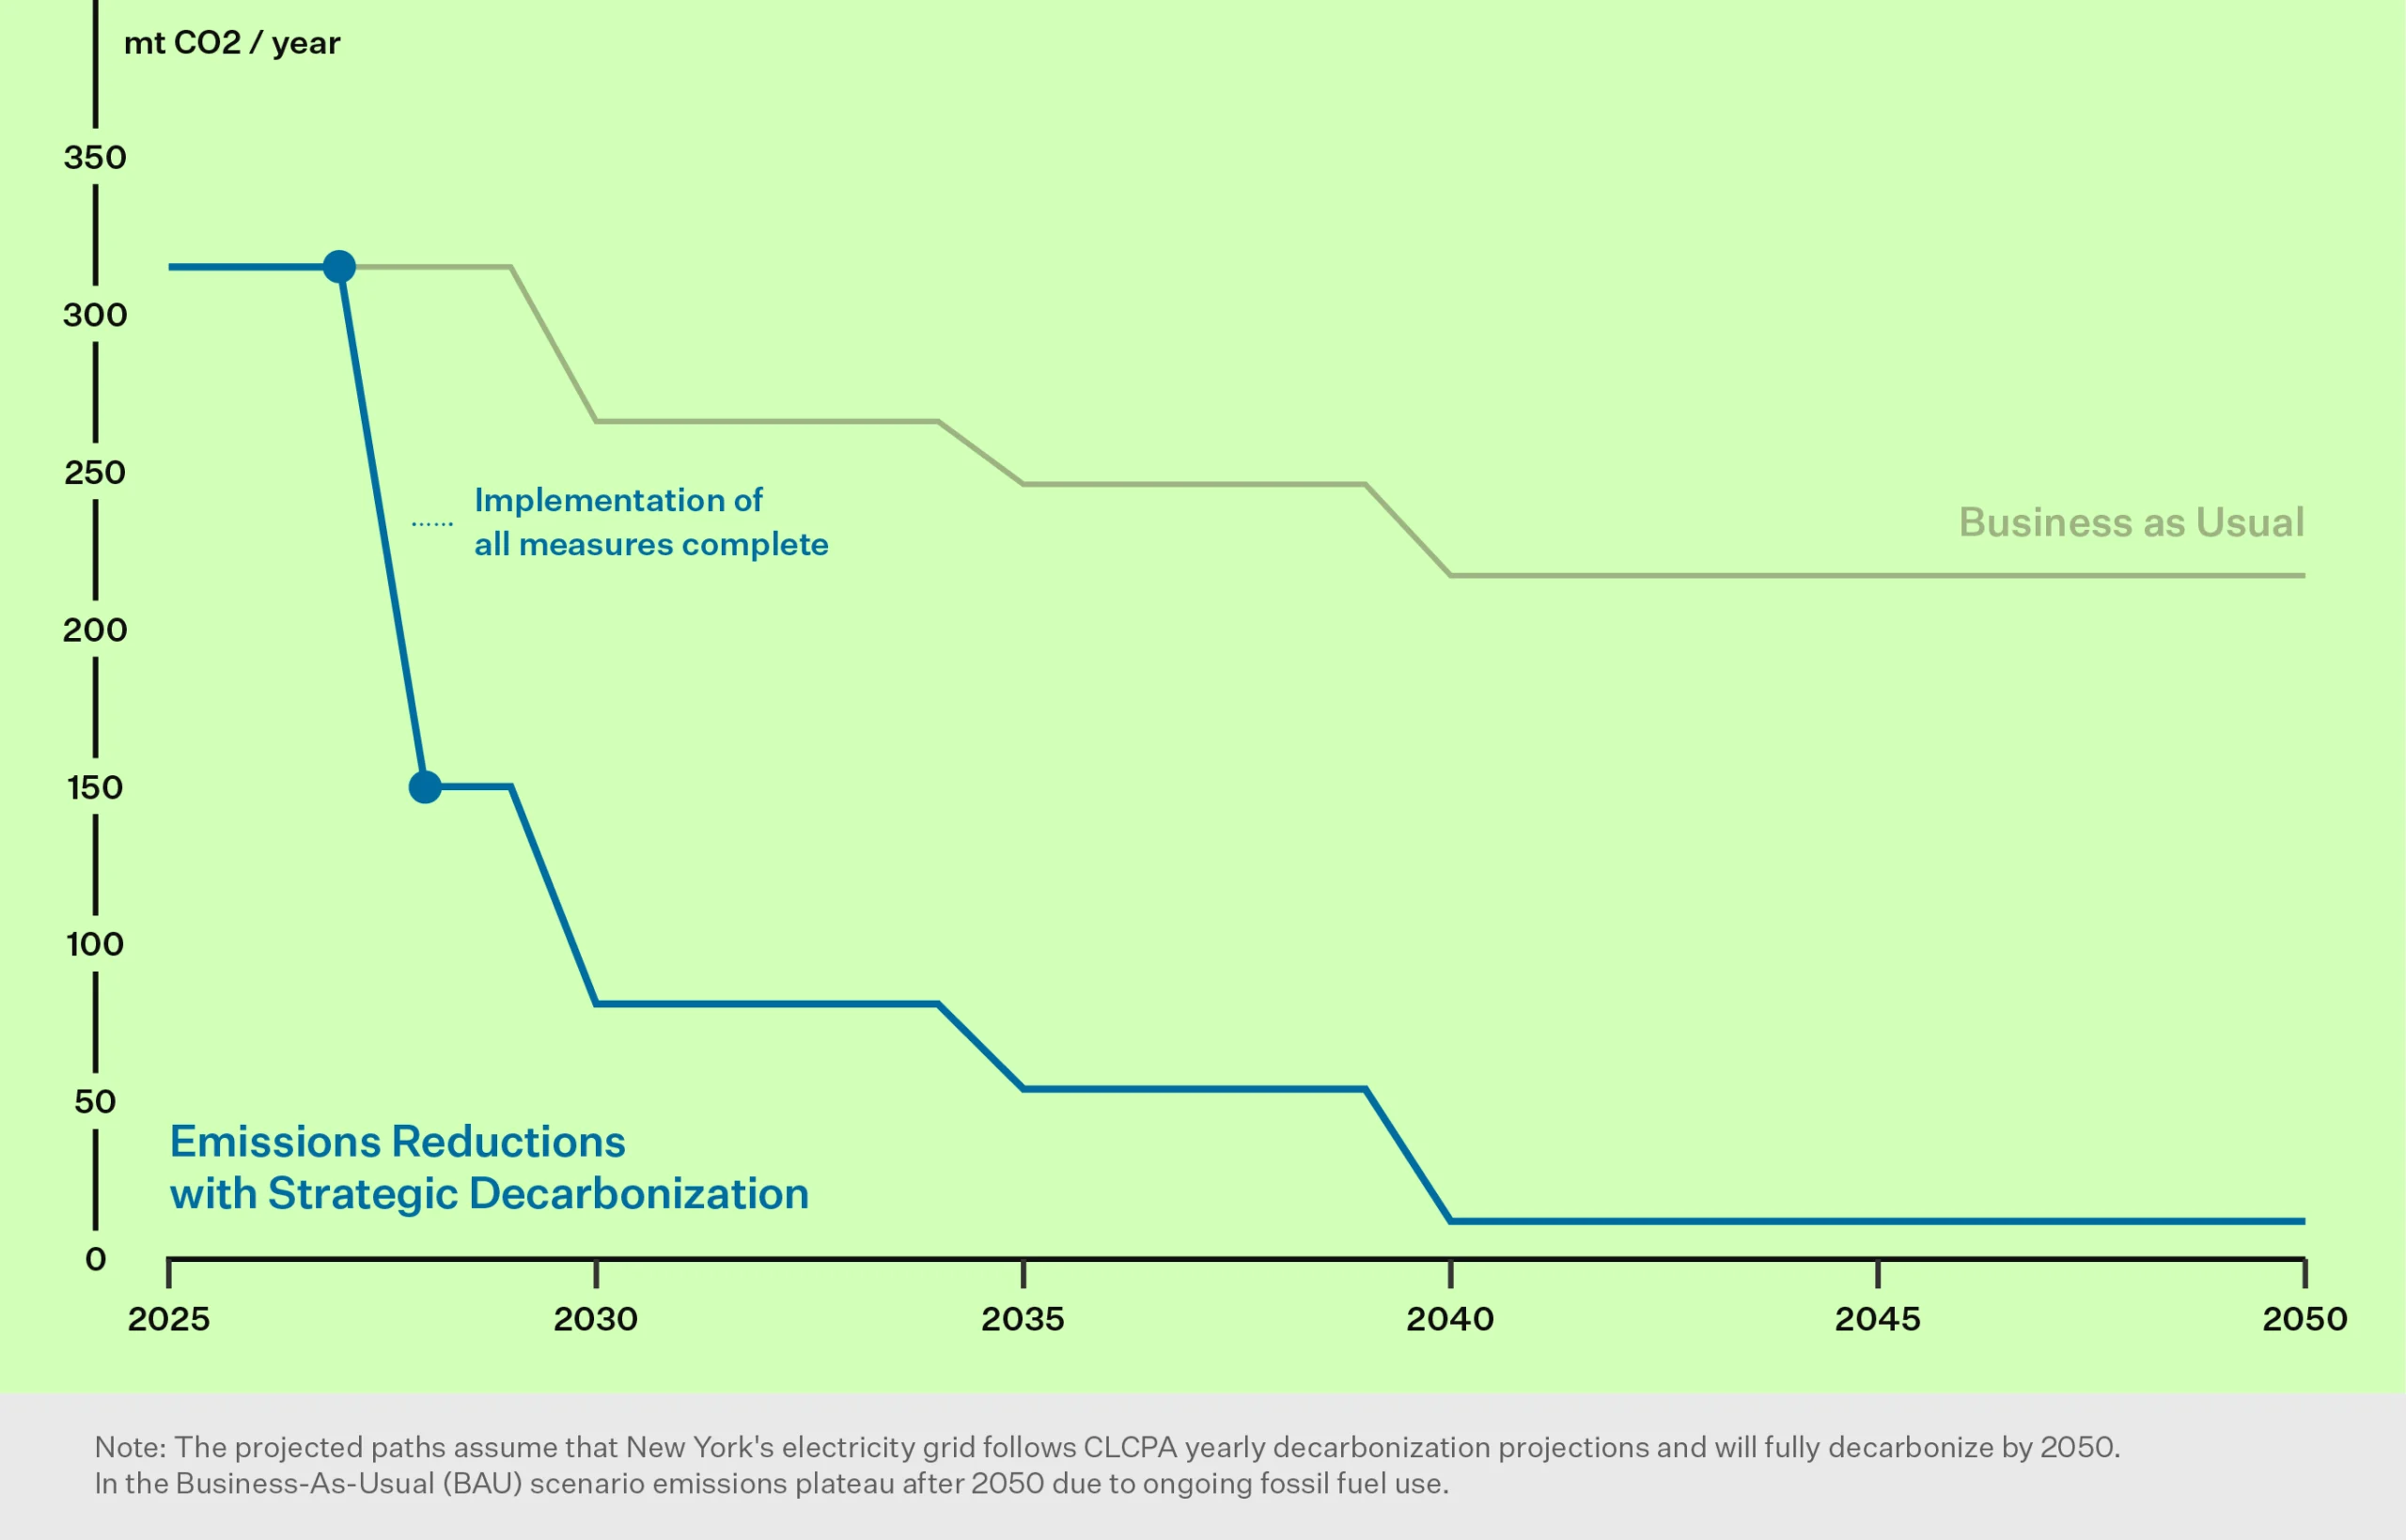
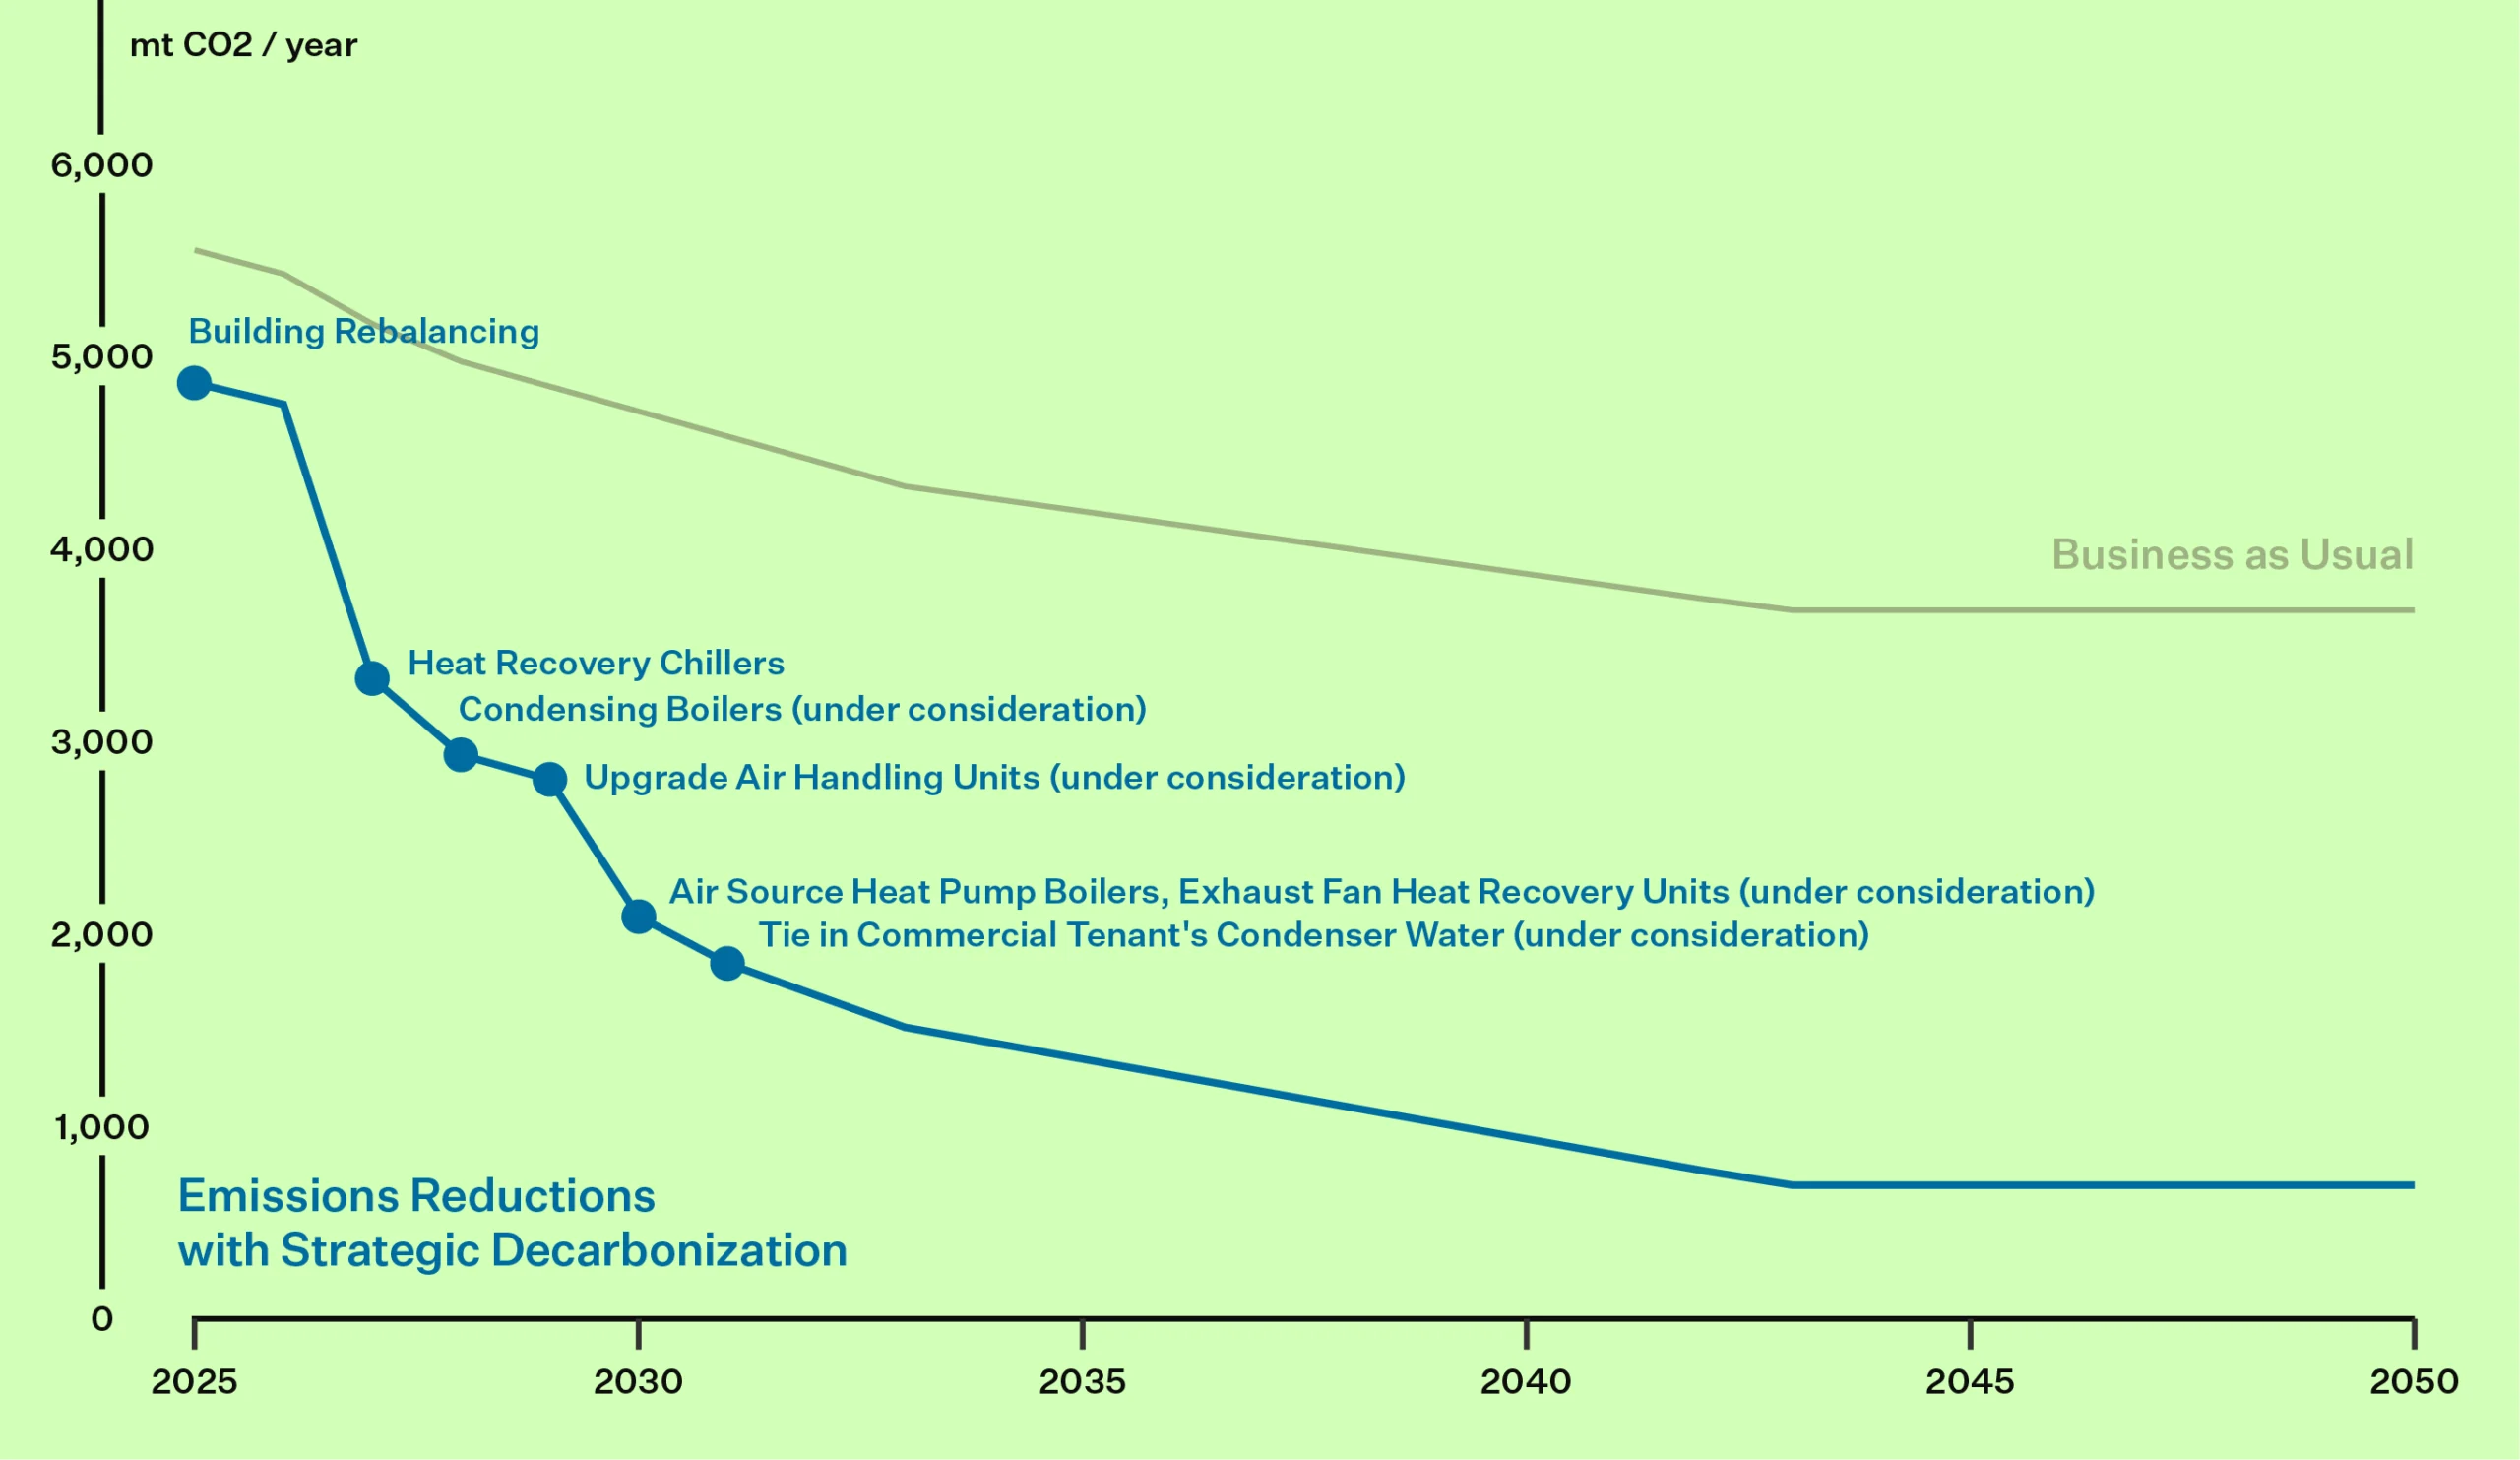
An emissions decarbonization roadmap helps building owners visualize their future emissions reductions by outlining the CO2 reductions from selected energy conservation measures. This roadmap is designed with a phased approach, considering a 20- or 30-year timeline, and incorporates the evolving benefits of grid decarbonization, ensuring a comprehensive view of long-term environmental impact.
The decarbonization roadmap for the International Tailoring Company Building was developed through a detailed planning process focused on balancing sustainability goals with operational feasibility. The project began with a comprehensive assessment of the building’s energy systems, identifying inefficiencies and opportunities for modernization. Key decisions included transitioning the outdated two-pipe hydronic system to a low-temperature thermal network, integrating hybrid water-source heat pumps, and supplementing them with condensing boilers for resilience during extreme cold. Implementation was staged to minimize disruptions for residents, with a phased timeline that included equipment replacement, thermal network commissioning, and system optimization. Throughout the process, data-driven decision-making ensured that investments aligned with projected energy savings and carbon reductions. Reporting mechanisms were established to track progress toward eliminating LL97 fines and achieving compliance with NYC’s carbon reduction mandates, with the building positioned to exceed its 2050 targets. This phased, adaptive approach ensures both immediate and long-term benefits while aligning with broader decarbonization efforts. The future roadmap includes incremental improvements to the thermal envelope by encouraging a window project when an apartment is sold.
More Like This
Case Study
NYSERDA supported
Case Study
The Victory
Energy conservation analysis at midtown tower
Energy conservation analysis at midtown tower

Case Study
Case Study
The Towers
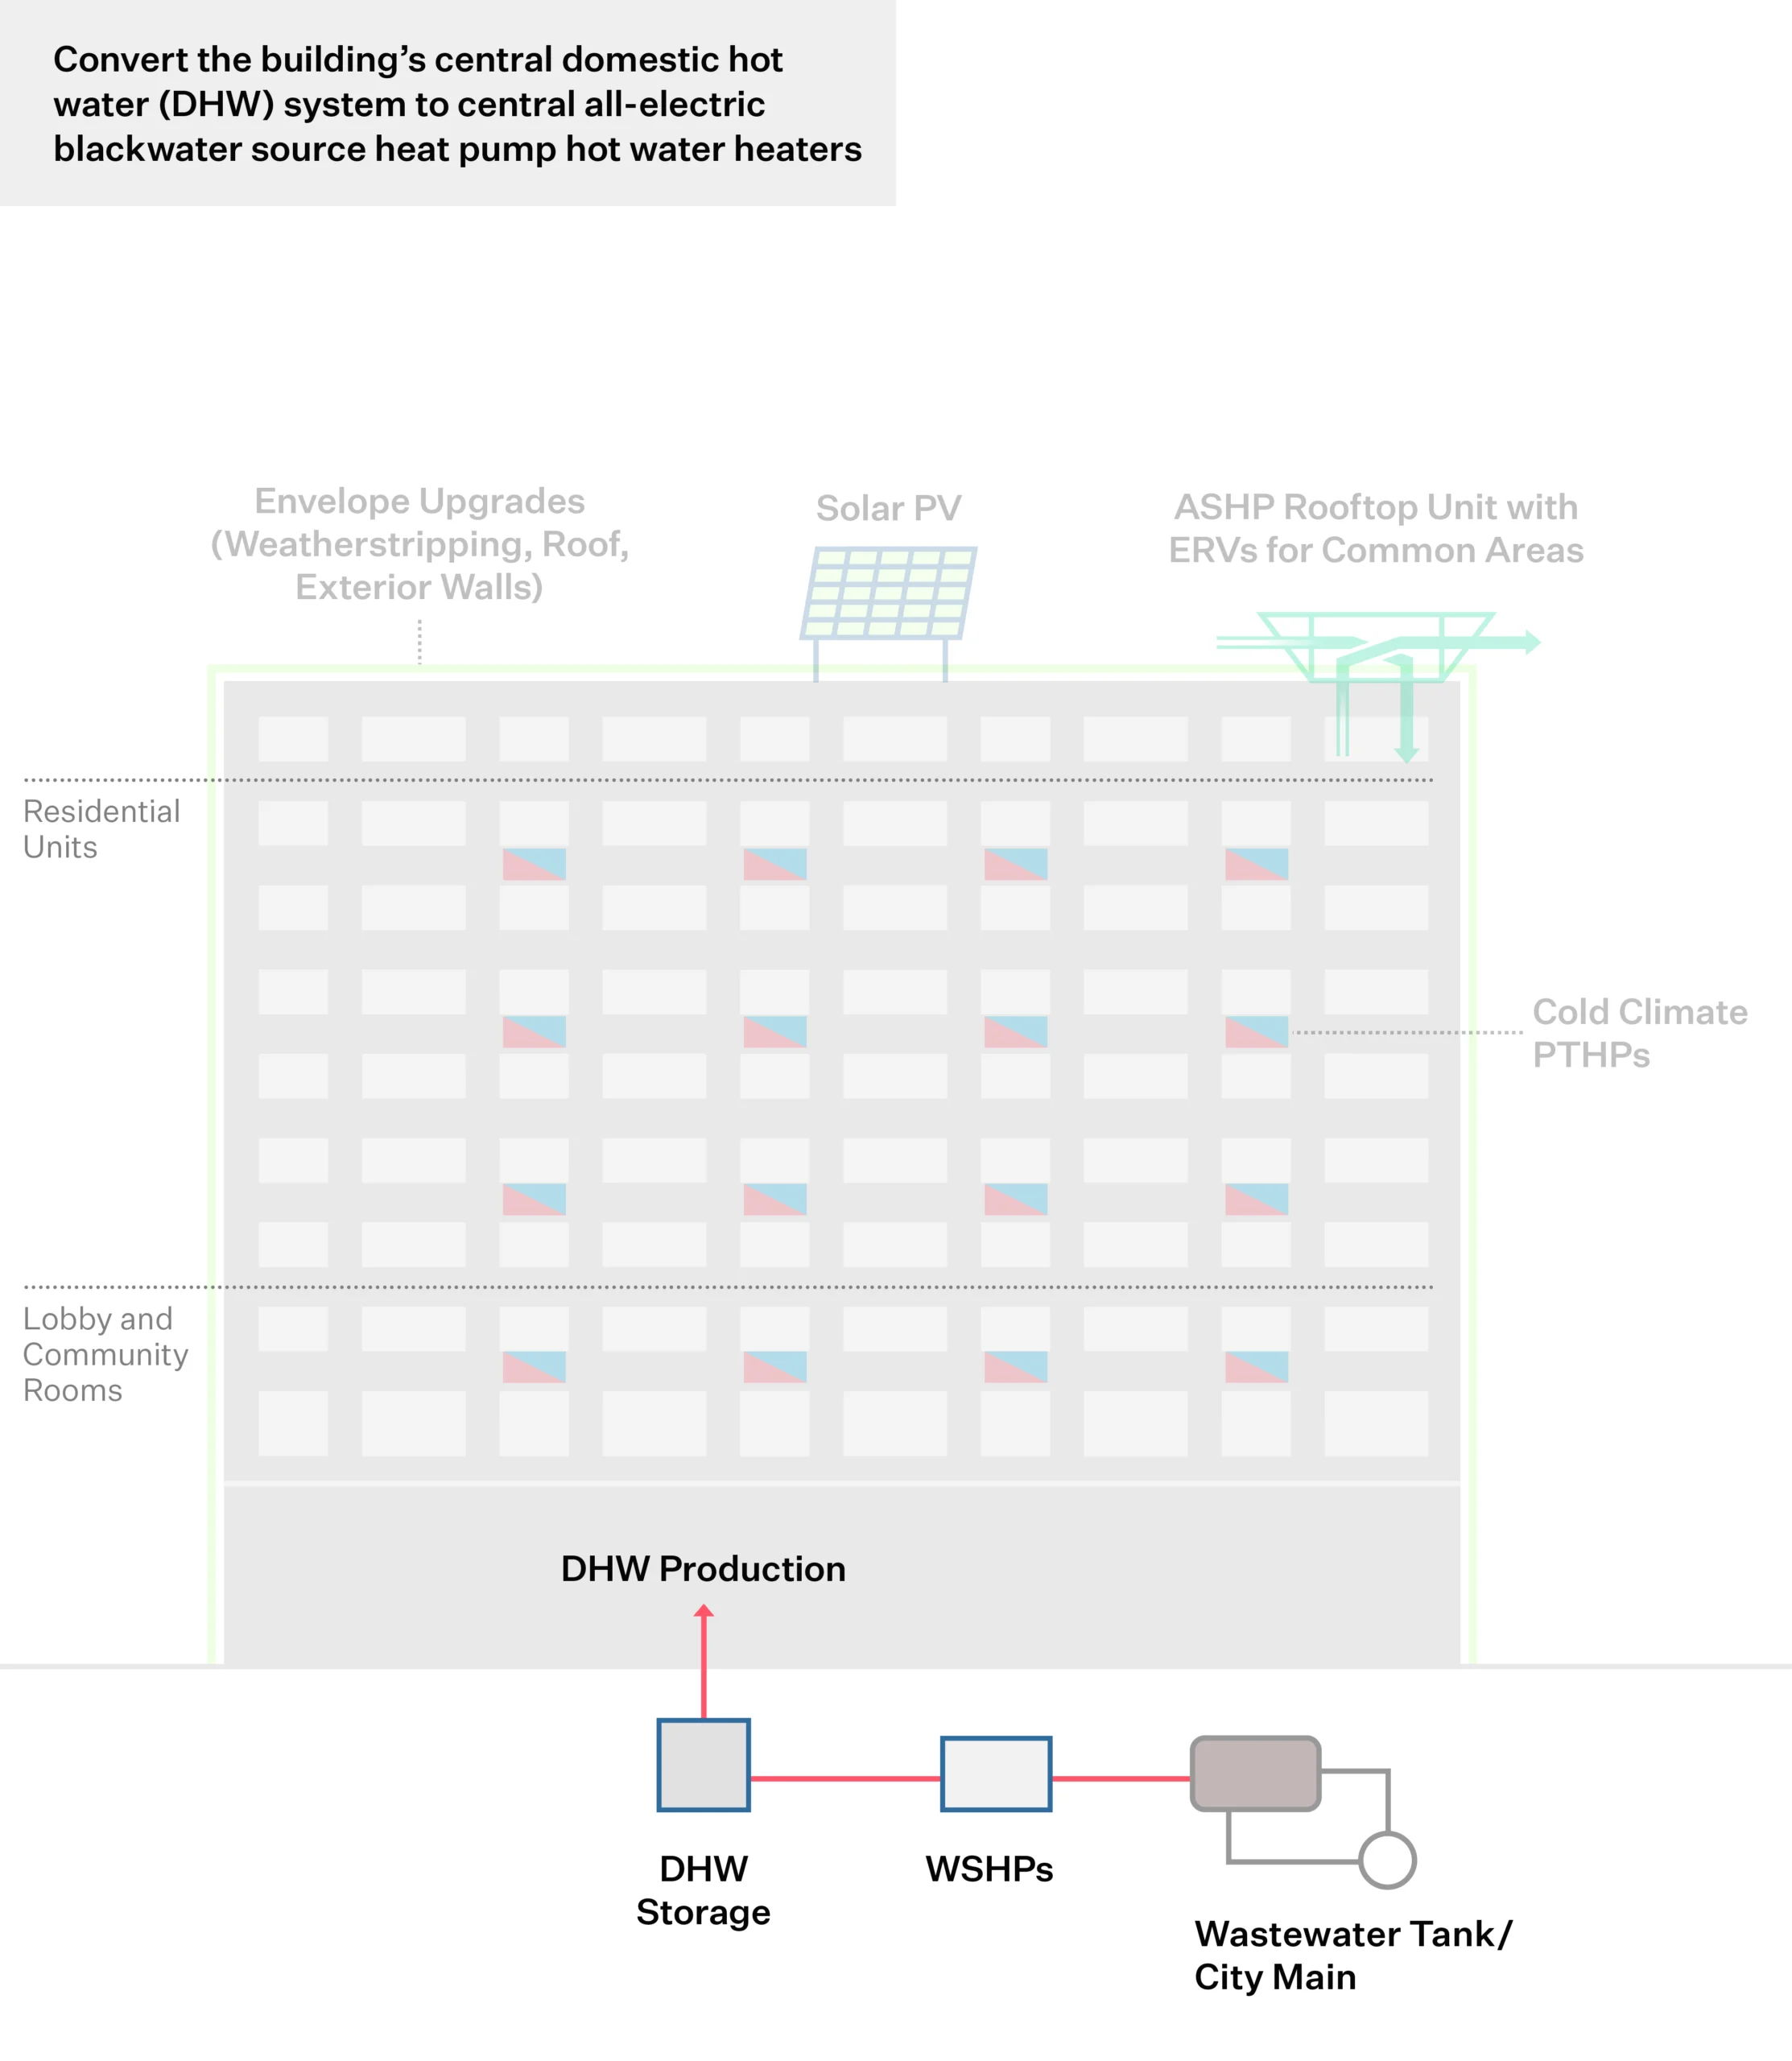
Oldest US multifamily co-op transforms wastewater into clean energy